(i) (ii) (iii) (iv) The breakeven point for this situation Contribution margin Using a production range from zero to 10,000 units a month, develop the following cost- volume-profit graphical presentation, and explain their significance. (a) A breakeven chart (b) A profit-volume graph Discuss possible strategies of the company to decrease breakeven point, Contribution margin, and increase profitability without increasing the selling price per unit.
(i) (ii) (iii) (iv) The breakeven point for this situation Contribution margin Using a production range from zero to 10,000 units a month, develop the following cost- volume-profit graphical presentation, and explain their significance. (a) A breakeven chart (b) A profit-volume graph Discuss possible strategies of the company to decrease breakeven point, Contribution margin, and increase profitability without increasing the selling price per unit.

Practical Management Science
6th Edition
ISBN:9781337406659
Author:WINSTON, Wayne L.
Publisher:WINSTON, Wayne L.
Chapter2: Introduction To Spreadsheet Modeling
Section: Chapter Questions
Problem 20P: Julie James is opening a lemonade stand. She believes the fixed cost per week of running the stand...

Related questions
Question
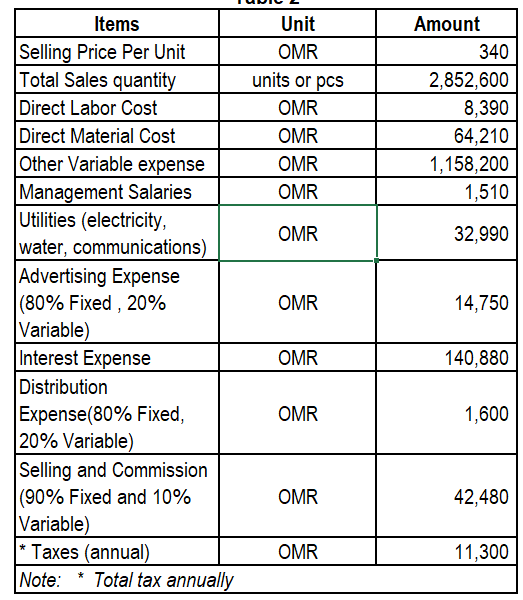
Transcribed Image Text:Items
Selling Price Per Unit
Total Sales quantity
Direct Labor Cost
Direct Material Cost
Other Variable expense
Management Salaries
Utilities (electricity,
water, communications)
Advertising Expense
(80% Fixed, 20%
Variable)
Interest Expense
Distribution
Expense(80% Fixed,
20% Variable)
Selling and Commission
(90% Fixed and 10%
Variable)
*Taxes (annual)
Note: Total tax annually
*
Unit
OMR
units or pcs
OMR
OMR
OMR
OMR
OMR
OMR
OMR
OMR
OMR
OMR
Amount
340
2,852,600
8,390
64,210
1,158,200
1,510
32,990
14,750
140,880
1,600
42,480
11,300
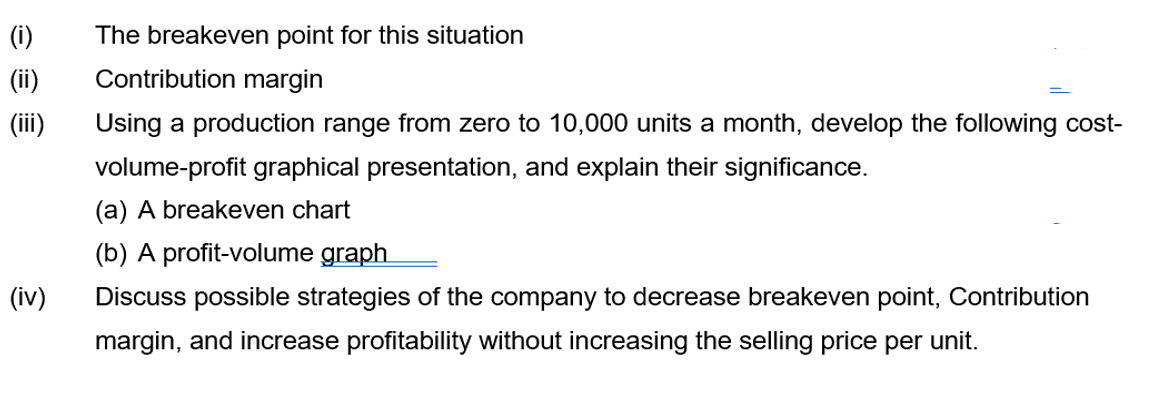
Transcribed Image Text:(i)
(ii)
(iii)
(iv)
The breakeven point for this situation
Contribution margin
Using a production range from zero to 10,000 units a month, develop the following cost-
volume-profit graphical presentation, and explain their significance.
(a) A breakeven chart
(b) A profit-volume graph
Discuss possible strategies of the company to decrease breakeven point, Contribution
margin, and increase profitability without increasing the selling price per unit.
Expert Solution
This question has been solved!
Explore an expertly crafted, step-by-step solution for a thorough understanding of key concepts.

Step by step
Solved in 4 steps with 9 images

Recommended textbooks for you
Practical Management Science
Operations Management
ISBN:
9781337406659
Author:
WINSTON, Wayne L.
Publisher:
Cengage,

Operations Management
Operations Management
ISBN:
9781259667473
Author:
William J Stevenson
Publisher:
McGraw-Hill Education

Operations and Supply Chain Management (Mcgraw-hi…
Operations Management
ISBN:
9781259666100
Author:
F. Robert Jacobs, Richard B Chase
Publisher:
McGraw-Hill Education
Practical Management Science
Operations Management
ISBN:
9781337406659
Author:
WINSTON, Wayne L.
Publisher:
Cengage,
Operations Management
Operations Management
ISBN:
9781259667473
Author:
William J Stevenson
Publisher:
McGraw-Hill Education
Operations and Supply Chain Management (Mcgraw-hi…
Operations Management
ISBN:
9781259666100
Author:
F. Robert Jacobs, Richard B Chase
Publisher:
McGraw-Hill Education


Purchasing and Supply Chain Management
Operations Management
ISBN:
9781285869681
Author:
Robert M. Monczka, Robert B. Handfield, Larry C. Giunipero, James L. Patterson
Publisher:
Cengage Learning

Production and Operations Analysis, Seventh Editi…
Operations Management
ISBN:
9781478623069
Author:
Steven Nahmias, Tava Lennon Olsen
Publisher:
Waveland Press, Inc.