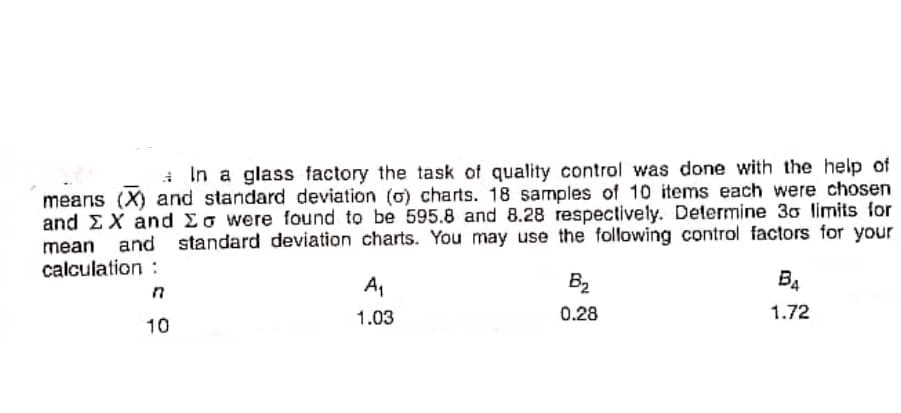
i In a glass factory the task of quality control was done with the help of means (X) and standard deviation (o) charts. 18 samples of 10 items each were chosen and EX and Eo were found to be 595.8 and 8.28 respectively. Determine 30 limits for and standard deviation charts. You may use the following control factors for your mean calculation : A, B2 B4 1.03 0.28 1.72 10
i In a glass factory the task of quality control was done with the help of means (X) and standard deviation (o) charts. 18 samples of 10 items each were chosen and EX and Eo were found to be 595.8 and 8.28 respectively. Determine 30 limits for and standard deviation charts. You may use the following control factors for your mean calculation : A, B2 B4 1.03 0.28 1.72 10

Glencoe Algebra 1, Student Edition, 9780079039897, 0079039898, 2018
18th Edition
ISBN:9780079039897
Author:Carter
Publisher:Carter
Chapter10: Statistics
Section10.5: Comparing Sets Of Data
Problem 13PPS

Related questions
Question
Transcribed Image Text:In a glass factory the task of quality control was done with the help of
means (X) and standard deviation (o) charts. 18 samples of 10 items each were chosen
and EX and Eo were found to be 595.8 and 8.28 respectively. Determine 30 limits for
and standard deviation charts. You may use the following control factors for your
mean
calculation :
A,
B2
B4
1.03
0.28
1.72
10
Expert Solution
This question has been solved!
Explore an expertly crafted, step-by-step solution for a thorough understanding of key concepts.

Step by step
Solved in 2 steps with 2 images

Recommended textbooks for you
Glencoe Algebra 1, Student Edition, 9780079039897…
Algebra
ISBN:
9780079039897
Author:
Carter
Publisher:
McGraw Hill
Glencoe Algebra 1, Student Edition, 9780079039897…
Algebra
ISBN:
9780079039897
Author:
Carter
Publisher:
McGraw Hill