I use this code but I cant get the graph from the picture. Why?? Code: t=(0:0.5:20); % t is a vector which contains time values from 0 to 20s with a step size of 0.5 a=sin(t); % a is a sin(t) function x=pi/6:15:pi/2; % phase difference φ for 30,45,60,90 b=sin(t+x); % b is a sin(t+x) funcion plot(t,a) % plot the sin(t) function with respect to t title('sin(t) versus Time') % add title to graph xlabel('time') % add x-label to the graph ylabel('sin(t)') % add y-label to the graph legend('sin(t)') % add legend to the graph figure % to plot multiple lines plot(t,a,t,b,'--') % plot the sint(t) & sin(t+x) function with respect to t title('Function versus Time') % add title to the graph xlabel('time') % add x-label to the graph ylabel('Function') % add y-label to the graph legend('sin(t)','sin(t+x)') % add legend to the graph % Create a figure divided into four subplots subplot(2,2,1) % divides the current figure into an 2-by-2 grid and creates axes in the position 1 y1=cos(t+(pi/6)); %y1 is cos(t+φ) function having a phase difference of φ 30 plot(t,y1) %plot the cos(t+30◦) function with respect to t title('Subplot 1: cos(t+30)') % add title to the graph xlabel('time') % add x-label to the graph ylabel('cos(t+3)') % add y-label to the graph legend('cos(t+30)') % add legend to the graph subplot(2,2,2) % divides the current figure into an 2-by-2 grid and creates axes in the position 2 y2=cos(t+(pi/4)); %y2 is cos(t+φ) function having a phase difference of φ 45 plot(t,y2) %plot the cos(t+45◦) function with respect to t title('Subplot 2: cos(t+45)') % add title to the graph xlabel('time') % add x-label to the graph ylabel('cos(t+45)') % add y-label to the graph legend('cos(t+45)') % add legend to the graph subplot(2,2,3) % divides the current figure into an 2-by-2 grid and creates axes in the position 3 y3=cos(t+(pi/3)); %y3 is cos(t+φ) function having a phase difference of φ 60 plot(t,y3) %plot the cos(t+60) function with respect to t title('Subplot 3: cos(t+60)') % add title to the graph xlabel('time') % add x-label to the graph ylabel('cos(t+60)') % add y-label to the graph legend('cos(t+60)') % add legend to the graph subplot(2,2,4) % divides the current figure into an 2-by-2 grid and creates axes in the position 4 y4=cos(t+(pi/2)); %y4 is cos(t+φ) function having a phase difference of φ 90 plot(t,y4) %plot the cos(t+90) function with respect to t title('Subplot 4: cos(t+90)') % add title to the graph xlabel('time') % add x-label to the graph


I use this code but I cant get the graph from the picture. Why??
Code:
t=(0:0.5:20); % t is a
a=sin(t); % a is a sin(t) function
x=pi/6:15:pi/2; % phase difference φ for 30,45,60,90
b=sin(t+x); % b is a sin(t+x) funcion
plot(t,a) % plot the sin(t) function with respect to t
title('sin(t) versus Time') % add title to graph
xlabel('time') % add x-label to the graph
ylabel('sin(t)') % add y-label to the graph
legend('sin(t)') % add legend to the graph
figure % to plot multiple lines
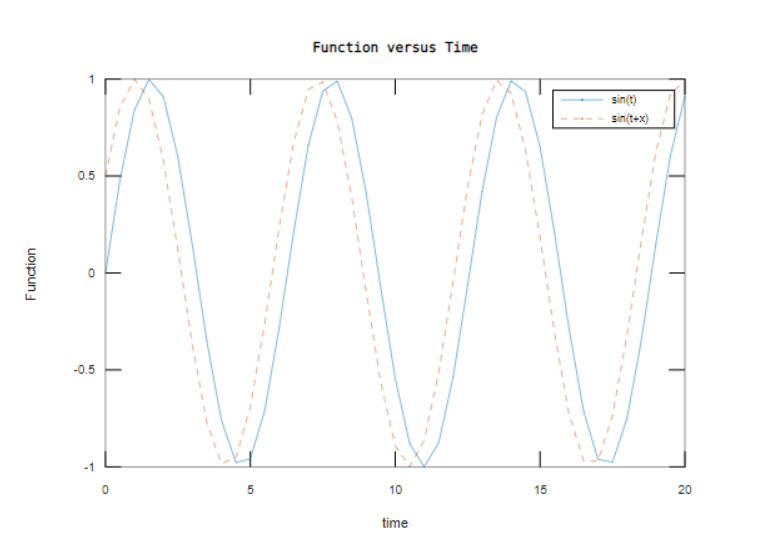
plot(t,a,t,b,'--') % plot the sint(t) & sin(t+x) function with respect to t
title('Function versus Time') % add title to the graph
xlabel('time') % add x-label to the graph
ylabel('Function') % add y-label to the graph
legend('sin(t)','sin(t+x)') % add legend to the graph
% Create a figure divided into four subplots
subplot(2,2,1) % divides the current figure into an 2-by-2 grid and creates axes in the position 1
y1=cos(t+(pi/6)); %y1 is cos(t+φ) function having a phase difference of φ 30
plot(t,y1) %plot the cos(t+30◦) function with respect to t
title('Subplot 1: cos(t+30)') % add title to the graph
xlabel('time') % add x-label to the graph
ylabel('cos(t+3)') % add y-label to the graph
legend('cos(t+30)') % add legend to the graph
subplot(2,2,2) % divides the current figure into an 2-by-2 grid and creates axes in the position 2
y2=cos(t+(pi/4)); %y2 is cos(t+φ) function having a phase difference of φ 45
plot(t,y2) %plot the cos(t+45◦) function with respect to t
title('Subplot 2: cos(t+45)') % add title to the graph
xlabel('time') % add x-label to the graph
ylabel('cos(t+45)') % add y-label to the graph
legend('cos(t+45)') % add legend to the graph
subplot(2,2,3) % divides the current figure into an 2-by-2 grid and creates axes in the position 3
y3=cos(t+(pi/3)); %y3 is cos(t+φ) function having a phase difference of φ 60
plot(t,y3) %plot the cos(t+60) function with respect to t
title('Subplot 3: cos(t+60)') % add title to the graph
xlabel('time') % add x-label to the graph
ylabel('cos(t+60)') % add y-label to the graph
legend('cos(t+60)') % add legend to the graph
subplot(2,2,4) % divides the current figure into an 2-by-2 grid and creates axes in the position 4
y4=cos(t+(pi/2)); %y4 is cos(t+φ) function having a phase difference of φ 90
plot(t,y4) %plot the cos(t+90) function with respect to t
title('Subplot 4: cos(t+90)') % add title to the graph
xlabel('time') % add x-label to the graph
ylabel('cos(t+90)') % add y-label to the graph
legend('cos(t+90)') % add legend to the graph

Step by step
Solved in 2 steps with 1 images


