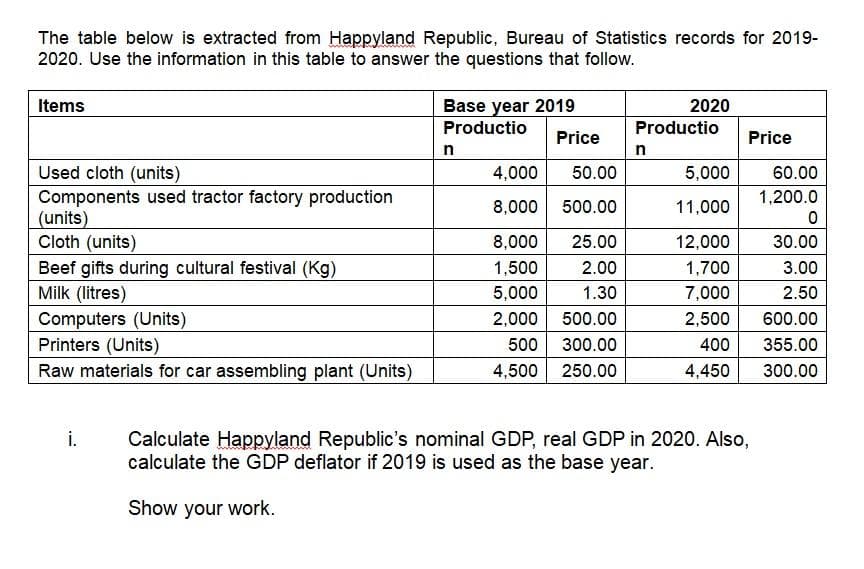
i. Calculate Happyland Republic's nominal GDP, real GDP in 2020. Also, calculate the GDP deflator if 2019 is used as the base year. Show your work.


Q: Examine the status of the economic welfare in Goodland Republic in 2018 based on your GDP deflator,…
A: Gross domestic product (GDP) is the money value of all goods and services produced in an economy…
Q: In 2010 norminal gdp was approximately 14.5 trillion in 2011 it was approximately 15.1 trillion…
A: The percentage change is given by the following formula,
Q: True/False # Nominal GDP can never be less than Real GDP Please be quick
A: # Lets First consider the concepts of nominal GDP and real GDP. Nominal GDP refers to the values of…
Q: a) Compute nominal GDP, real GDP, and the GDP deflator for each year, using 2010 as the base year.…
A: .The nominal GDP of a country is calculated using current prices and is not adjusted for inflation.…
Q: What are typical GDP patterns for a high-income economy like the United States in the long run and…
A: Gross Domestic Product (GDP) is denied as the total nominal value of all complete commodities or…
Q: The table below is extracted from Goodland Republic Bureau of Statistics records for 2016 -2017. Use…
A: The value of all the final goods and services produced in an economy during a financial year is…
Q: In the United States in 2002, the GDP price index was 89..5 and nomial GDP was 10978 billion What…
A: GDP price index for 2002 = 89.5Nominal GDP in 2002 = 10978 millionReal GDP in 2002 = Nominal GDP in…
Q: Real GDP measure changes in: A) Prices, but no production B) Production, but not prices C) Prices…
A: Real GDP- It is a microeconomic static by which the value of goods and services produced by an…
Q: If nominal GDP rose, does that mean that production had to increase as well? Why or why not? What…
A: Solution- Nominal GDP - Nominal GDP is a measurement of country's output at current market price .…
Q: If Gdp deflator is less than 100 it means that : 1- stagflation 2- deflation 3- inflation…
A: The GDP deflator is an economy measure that is used to compute the inflation rate in the economy in…
Q: A country has nominal GDP equal to $206.53 billion in 2018. The GDP deflator in 2018 has a value of…
A: Formula Used:
Q: i. Calculate Happy Land Republic's nominal GDP and real GDP in 2016 ii. Why does real GDP always…
A: GDP excludes used goods, intermediate goods and production inputs, so only the values of Cloth,…
Q: Fill in the blanks in the table below. Nominal GDP Real GDP growth Country growth Population growth…
A: As per the fisher's equation, Real GDP growth rate = Nominal GDP growth rate - Inflation rate r = n…
Q: Is it possible to figure out nominal GDP and real GDP of each three years with no price or quantity…
A: Nominal GDP refers to the value of GDP which is not adjusted to inflation whereas real GDP refers to…
Q: Nominal GDP does not include inflation?
A: GDP measures the market value of all goods and services produced in the economy.
Q: real GDP
A: Answer: b. base year Prices method Real GDP : When GDP of a given years is estimated on basis of…
Q: a. If the price of protein bars rose from $2.40 to $2.70 over this period, while the price of…
A: Nominal GDP = Price of goods in current year * Quantity of goods in current year Real GDP = Price of…
Q: Instructions: Round your responses to the nearest billion, If you are entering any negative numbers…
A: The given table gives information about the nominal GDP and GDP deflator for year 2000 to 2019.
Q: The GDP deflator in year 2 is ETTT Quantity Quantity Product Price (Year 1) Price (Year 2) (Year 1)…
A: "Inflation is the rise in the price level of the economy." Over time, the price of goods and…
Q: How are nominal and real GDP calculated?
A: Nominal GDP refer to the market value of all final goods and services produced in an economy during…
Q: An economy produces only food and fun. The table shows the quantities produced and prices in 2018…
A: The term ‘GDP’ or gross domestic product refers to the market value of all services and commodities…
Q: Why the use real GDP is preferred by economists over nominal GDP to gauge economic well-being? (100…
A: Real GDP is the GDP which the economy is actually producing ie after the inflation has been taken…
Q: Is GDP a main indicator of a country's economic well-being? Why and why not?
A: Gross domestic product is the money value of all final goods and services produced by normal…
Q: what is the nominal GDP for year 2019?
A: Gross domestic price is also known as nominal GDP
Q: What is india total gdp?
A: The total monetary or market worth of all finished goods and services produced within a country's…
Q: GDP in 1981 was $2.96 trillion. It grew to $3.07 trillion in 1982, yet the quantity of output…
A: GDP in 1981 was $2.96 trillion. It grew to $3.07 trillion in 1982, yet the quantity of output…
Q: Distinguish between real and nominal GDP. Which one is a better measure of the business cycle?
A: The GDP is the summation of money value of all the final goods and services produced within the…
Q: Discuss whether GDP is always reliable and accurate in reflecting economic performance of a country.…
A: GDP is that the price of all the finished merchandise and services created at intervals a country'…
Q: Why the use real GDP is preferred by economists over nominal GDP to gauge economic well-being?
A: Gross Domestic Product denotes the total aggregate output that is produced in the country at a given…
Q: When GDP is measured in "current prices" it is known as the O A) real GDP. B) nominal GDP. C)…
A: Gross domestic product is the market value of all the services and finished goods being produced…
Q: If nominal GDP grows by 7% but inflation rises 3%, what is the real GDP?
A: Given that, nominal GDP grows by 7% but inflation rises 3%, what is the real GDP.
Q: An economy produces turmeric for consumption, produces Cardamom to export, and imports sesame seeds…
A: a) Using 2015 as base year and calculating GDP for each year; Real GDP=Base year price×Current year…
Q: If nominal GDP was roughly $10,000 and the GDP deflator was 110 in 2016, real GDP is closest to a…
A: Real GDP is the inflation adjusted value , so here we calculate the value of real GDP by using the…
Q: Suppose that nominal GDP was $9250000.00 in 2005 in Orange County California. In 2015, nominal GDP…
A: A) Nominal GDP growth rate is the % change in nominal GDP from 2005 to 2015 nominal GDP growth =…
Q: What two thing gdp measure?
A: GDP: It refers to the goods and services which has been produced in an economy. The more the GDP of…
Q: Why do economists use the real GDP rather than the nominal GDP to gauge the economic well-being?
A: Answer - The Economist use real GDP rather than the nominal GDP to gauge the economics well -being…
Q: In 2014, GDP was $12 million and the price of the market basket was $4O. In 2020, GDP was $15…
A: Both GDP and market basket increased in 2020.
Q: Calculate real income for 2017 and 2018. How much growth rate from year 2017 to 2018?
A: Nominal GNP means GNP at current prices but real income means GNP at constant prices. So, to…
Q: GDP rises from $5.5 trillion in 2014, the base year, to $9.5 trillion in 2018. The GDP deflator in…
A: Nominal GDP = Current Year Prices * Current Year Quantities Real GDP = Base Year Prices * Current…
Q: C + G + I + NX ≡ Y ≡ YD + (TA − TR) ≡ C + S + (TA − TR) How is the above identity be used to…
A: The given identity is the macroeconomic identity which conveys the basic fact that the aggregate…
Q: If nominal GDP for 2017 is $62 trillion and real GDP for 2017 is $46 trillion, then the GDP deflator…
A: The GDP deflator measures the changes in prices for all of the goods and services produced in an…
Q: a) Compute the nominal GDP in 2018. b) Compute the real GDP in 2018? c) Compute the nominal GDP in…
A: Given 2018 as the base year Nominal GDP = Current Year price * Current year quantity Real GDP =…
Q: Real GDP is a. the nominal value of all real goods produced in the nation in year. b. Nominal GDP…
A: Real GDP refers to the value of all final goods and services that produced within the economy during…
Q: d. Use GDP deflator to compute the inflation rate from 2006 to 2007 and from 2007 to 2008.
A: We know that, The GDP deflator in 2006 = 100 The GDP deflator in 2007 = 102.8 The GDP deflator in…
Q: How do you convert a series of nominal economic data over time to real terms?
A: When studying economic statistics, it's critical to understand the difference between real and…
Q: a. Explain in what way GDP is a measure of the standard of living in a country.
A: “Since you have asked multiple questions, we will solve the first question for you. If you want any…
Q: In Anasville nominal GDP in 2030 is $30,000 and the price index (base of 100 in 2020) stands at 150.…
A: Nominal GDP in 2030 is $30,000 the price index (base of 100 in 2020) stands at 150

Step by step
Solved in 2 steps with 1 images

- The table below is extracted from Happy land Republic, Bureau of Statistics recordsfor 2018-2019. Use the information in this table to answer the questions that follow. item base year 2015 2016 production price production price used car sales 5,000 2000.00 6,000 2,500 factories components sales 8,000 500.00 10,000 1200.00 cloth sales 8,000 20.00 14,000 35.00 beef sales 1,500 10.00 1,800 12.00 milk litres sales 5,000 1.30 6,000 2.50 computers sales 2000 500.00 2500 800.00 printers sales 500 300.00 400 355.00 raw materials for tractor assembling plant sales 4500 250.00 4450 300.00 i. Calculate Happy Land Republic’s nominal GDP and real GDP in 2016ii. Why does real GDP always defer from nominal GDP?FORCASTING using the data below can you answer the question: Month Sales Jan-16 747 Feb-16 697 Mar-16 1014 Apr-16 1126 May-16 1105 Jun-16 1450 Jul-16 1639 Aug-16 1711 Sep-16 1307 Oct-16 1223 Nov-16 975 Dec-16 953 Jan-17 1024 Feb-17 928 Mar-17 1442 Apr-17 1371 May-17 1536 Jun-17 2004 Jul-17 1854 Aug-17 1951 Sep-17 1516 Oct-17 1642 Nov-17 1166 Dec-17 1106 Jan-18 1189 Feb-18 1209 Mar-18 1754 Apr-18 1843 May-18 1769 Jun-18 2207 Jul-18 2471 Aug-18 2288 Sep-18 1867 Oct-18 1980 Nov-18 1418 Dec-18 1333 Jan-19 1333 Feb-19 1370 Mar-19 2142 Apr-19 2138 May-19 2078 Jun-19 2960 Jul-19 2616 Aug-19 2861 Sep-19 2237 Oct-19 2225 Nov-19 1590 Dec-19 1659 Jan-20 1613 Feb-20 1605 Mar-20 2349 Apr-20 2468 May-20 2532 Jun-20 3127 Jul-20 3288 Aug-20 3285 Sep-20 2485 Oct-20 2723 Nov-20 1835 Dec-20 1894 Consider five years of monthly profit for a company Plot the data and discuss its…FORCASTING using the data below can you answer the question: Month Sales Jan-16 747 Feb-16 697 Mar-16 1014 Apr-16 1126 May-16 1105 Jun-16 1450 Jul-16 1639 Aug-16 1711 Sep-16 1307 Oct-16 1223 Nov-16 975 Dec-16 953 Jan-17 1024 Feb-17 928 Mar-17 1442 Apr-17 1371 May-17 1536 Jun-17 2004 Jul-17 1854 Aug-17 1951 Sep-17 1516 Oct-17 1642 Nov-17 1166 Dec-17 1106 Jan-18 1189 Feb-18 1209 Mar-18 1754 Apr-18 1843 May-18 1769 Jun-18 2207 Jul-18 2471 Aug-18 2288 Sep-18 1867 Oct-18 1980 Nov-18 1418 Dec-18 1333 Jan-19 1333 Feb-19 1370 Mar-19 2142 Apr-19 2138 May-19 2078 Jun-19 2960 Jul-19 2616 Aug-19 2861 Sep-19 2237 Oct-19 2225 Nov-19 1590 Dec-19 1659 Jan-20 1613 Feb-20 1605 Mar-20 2349…
- Please no written by hand and no emage please help in summarising this data table into word form.1. Data collection, compilation, and analysis from secondary sources using suitable reference (APA, for example). 2.Examine acquired data and update it so that it is relevant to the context, audience, and purpose. 3. Text (facts, assertions, statistics, etc.) is combined with graphic components such as tables and figures to create a dynamic and entertaining presentation. to design a Message for a specific Audience, with a specific Purpose with the purpose of delivering a certain outcome. Deliver a 4-minute presentation on a topic of your choice that is clear and succinct. I propose that you select a topic that you are comfortable with. You may give a presentation on "how to make coffee in the morning" or "how to find the "best" parking spot," for example. Instructions Identify the presentation's goal and explain why your presentation will be beneficial to your audience. Provide clear and concise context to ensure that all topics are understood immediately. Make your presentation.…Using EViews, graph the series spread. Describe the main features seen in the graph and provide an economic explanation forthese features.
- Article Price 2003 Amount 2003 Price 2006 Amount 2006 nails (dozen) $2.49 6 $2.69 6 wire(kg) $3.29 4 $3.59 5 wire rod(kg) $1.59 2 $1.79 3 rings(pzas) $1.79 3 $2.29 4 The data are the prices in pesos of a group of products used in the housing construction industry and the quantities consumed in the years 2003 and 2006Based on the year 2003, determine:a) Simple indexes of prices, quantity and value of ringsb) Simple wire price, quantity and value indicesc) Laspeyres price indexd) Paasche price indexe) Fisher Price Indexf) Relative weighted average of prices thank you, I only need the d, e, f.Monthly Consumer Price Index from January 2015 to December 2020 (Source: STATIN) Month 2015 2016 2017 2018 2019 2020 January 85.4 88.6 90.9 95.2 97.4 102.5 February 84.8 87.9 91.1 95.1 97.4 103.2 March 85.3 87.8 91.4 95.0 98.2 102.9 April 85.4 87.5 91.7 94.6 98.3 103.7 May 85.9 87.7 91.8 94.6 99.1 103.8 June 86.3 88.5 92.4 95.0 99.0 105.2 July 87.0 88.9 92.9 95.9 100.0 105.7 August 87.7 89.3 93.2 96.8 100.8 105.9 September 88.1 89.7 93.8 97.9 101.2 106.1 October 88.4 89.9 94.2 98.6 101.8 106.9 November 88.8 90.3 94.7 98.6 103.2 107.6 December 89.0 90.5 95.2 97.6 103.6 109.0 From the Table above: In December 2018, Mr. Logan Hepburn began receiving a salary of $100,000 per month.Up to December 2020, his salary has remained unchanged. What is his ‘‘real wage’’ in December…Mm.38. Subject :- Economy