i. Find the mean and the median compensation of the executives. ii. Comment on the skewness of the distribution of the executives' compensations.
i. Find the mean and the median compensation of the executives. ii. Comment on the skewness of the distribution of the executives' compensations.

Glencoe Algebra 1, Student Edition, 9780079039897, 0079039898, 2018
18th Edition
ISBN:9780079039897
Author:Carter
Publisher:Carter
Chapter10: Statistics
Section10.6: Summarizing Categorical Data
Problem 30PPS

Related questions
Question
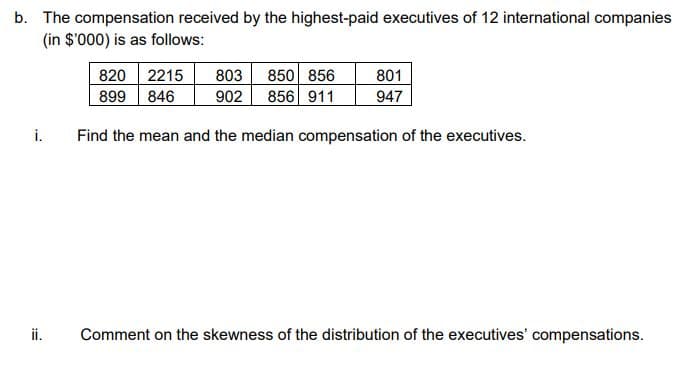
Transcribed Image Text:b. The compensation received by the highest-paid executives of 12 international companies
(in $'000) is as follows:
801
820 2215 803 850 856
899 846 902 856 911
947
i. Find the mean and the median compensation of the executives.
Comment on the skewness of the distribution of the executives' compensations.
2
Expert Solution
This question has been solved!
Explore an expertly crafted, step-by-step solution for a thorough understanding of key concepts.

This is a popular solution!

Trending now
This is a popular solution!

Step by step
Solved in 2 steps with 2 images

Recommended textbooks for you
Glencoe Algebra 1, Student Edition, 9780079039897…
Algebra
ISBN:
9780079039897
Author:
Carter
Publisher:
McGraw Hill
Glencoe Algebra 1, Student Edition, 9780079039897…
Algebra
ISBN:
9780079039897
Author:
Carter
Publisher:
McGraw Hill