Identify which of the variables is most likely to be the explanatory variable, and which is most likely to be the response variable. Explain. Identify whether each variable is categorical or quantitative, and classify the relationship as C→Q, C→C, or Q→Q, and explain how you know. Determine what type of data display and description is appropriate for the relationship, and explain why. Create an appropriate data display and describe the relationship using vocabulary appropriate to the type of data. Describe any potential lurking (confounding) variables and describe how this impacts association (correlation) versus causation. Describe what other information you can get from this data, or what other questions you might have about it.
Identify which of the variables is most likely to be the explanatory variable, and which is most likely to be the response variable. Explain. Identify whether each variable is categorical or quantitative, and classify the relationship as C→Q, C→C, or Q→Q, and explain how you know. Determine what type of data display and description is appropriate for the relationship, and explain why. Create an appropriate data display and describe the relationship using vocabulary appropriate to the type of data. Describe any potential lurking (confounding) variables and describe how this impacts association (correlation) versus causation. Describe what other information you can get from this data, or what other questions you might have about it.

Glencoe Algebra 1, Student Edition, 9780079039897, 0079039898, 2018
18th Edition
ISBN:9780079039897
Author:Carter
Publisher:Carter
Chapter10: Statistics
Section10.6: Summarizing Categorical Data
Problem 27PPS

Related questions
Question
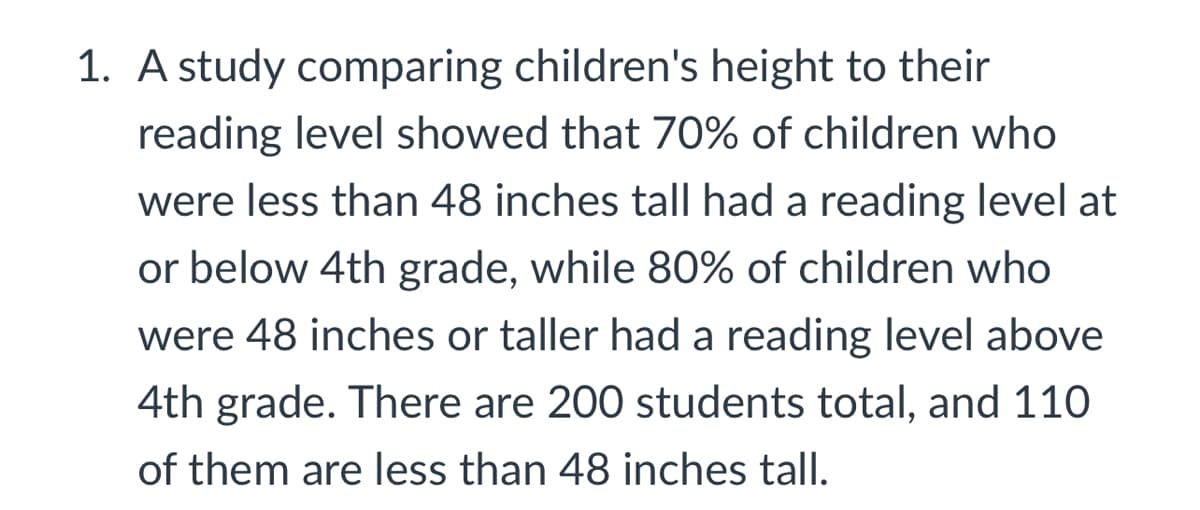
Transcribed Image Text:1. A study comparing children's height to their
reading level showed that 70% of children who
were less than 48 inches tall had a reading level at
or below 4th grade, while 80% of children who
were 48 inches or taller had a reading level above
4th grade. There are 200 students total, and 110
of them are less than 48 inches tall.
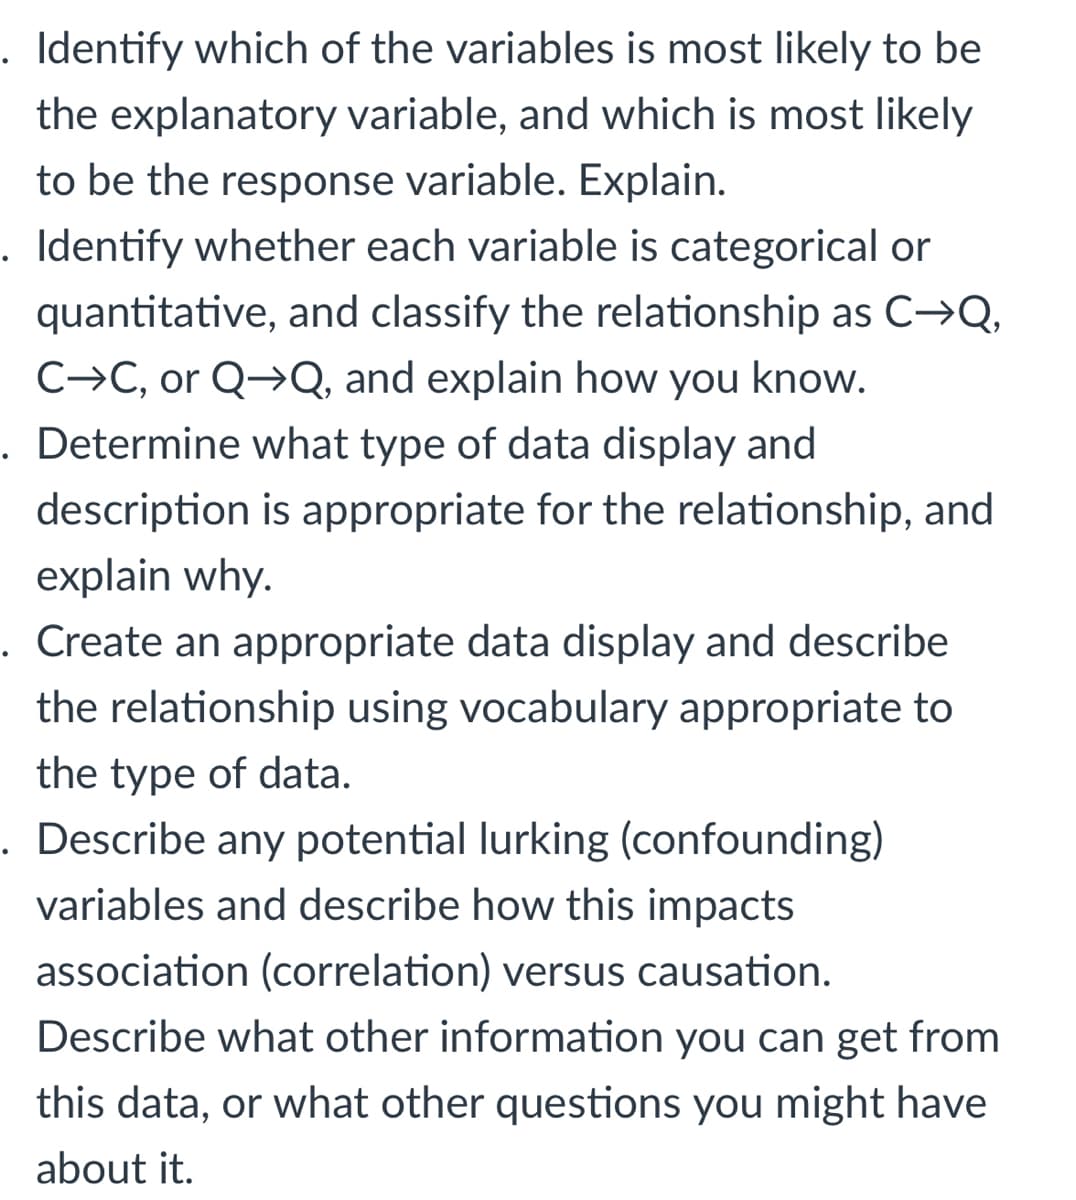
Transcribed Image Text:Identify which of the variables is most likely to be
the explanatory variable, and which is most likely
to be the response variable. Explain.
. Identify whether each variable is categorical or
quantitative, and classify the relationship as C→Q,
C→C, or Q→Q, and explain how you know.
. Determine what type of data display and
description is appropriate for the relationship, and
explain why.
. Create an appropriate data display and describe
the relationship using vocabulary appropriate to
the type of data.
. Describe any potential lurking (confounding)
variables and describe how this impacts
association (correlation) versus causation.
Describe what other information you can get from
this data, or what other questions you might have
about it.
Expert Solution
This question has been solved!
Explore an expertly crafted, step-by-step solution for a thorough understanding of key concepts.

Step by step
Solved in 3 steps

Recommended textbooks for you
Glencoe Algebra 1, Student Edition, 9780079039897…
Algebra
ISBN:
9780079039897
Author:
Carter
Publisher:
McGraw Hill
Glencoe Algebra 1, Student Edition, 9780079039897…
Algebra
ISBN:
9780079039897
Author:
Carter
Publisher:
McGraw Hill