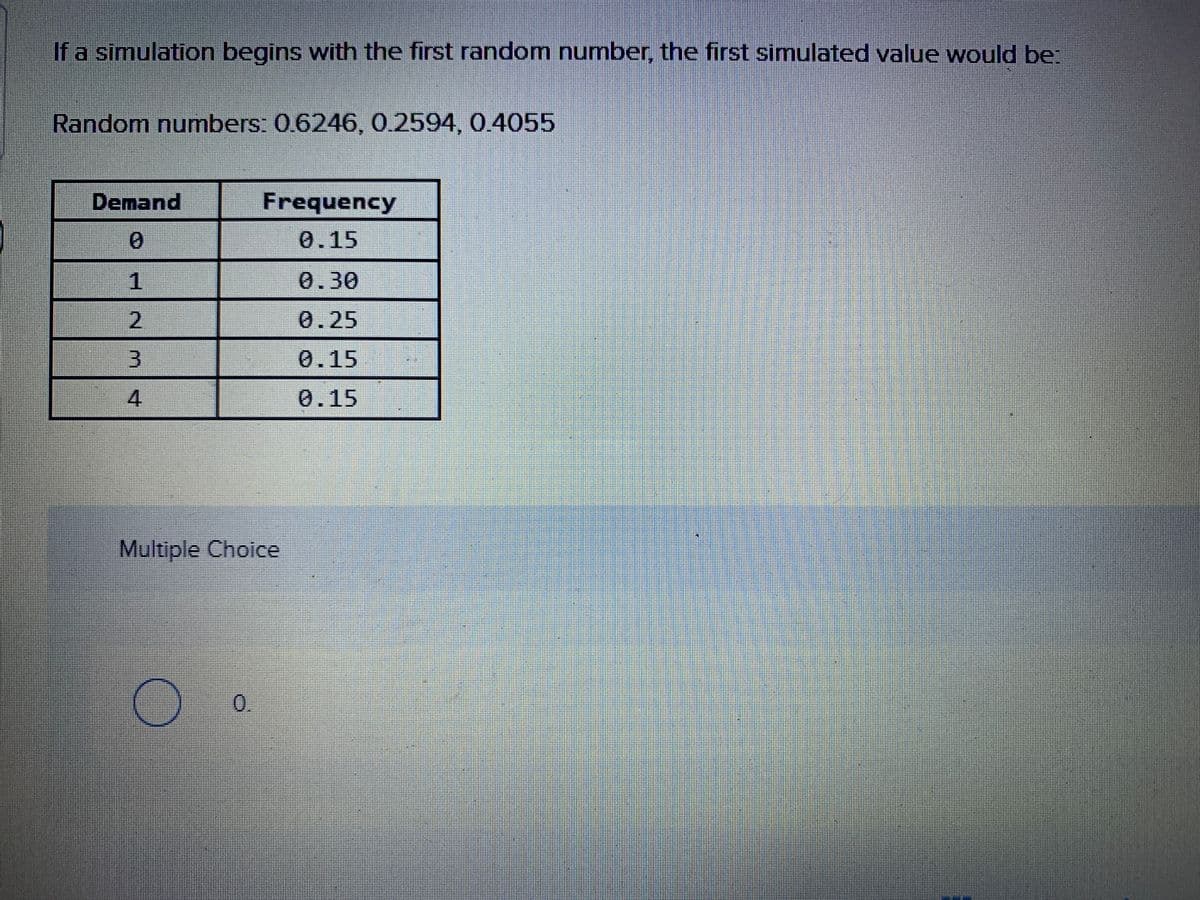
If a simulation begins with the first random number, the first simulated value would be: Random numbers: 0.6246, 0.2594, 0.4055 Demand Frequency 0.15 0.30 0.25 3 0.15 4 0.15


Q: The mean annual earning for U.S. workers with advanced degrees is $80,977 with a standard deviation…
A: Note, Since you have posted multiple subparts in the same questions, we will be answering the first…
Q: What is the probability that the dinner will be ready within 3 minutes early?
A: Below is the solution:-
Q: Precision Parts is a job shop that specializes in producing electric motor shafts. The average shaft…
A: Formula:
Q: Given this frequency distribution, what demand values would be associated with the following random…
A: The answer is as below:
Q: You have determined that walting times at a toll booth are uniformly distributed over the interval…
A: Below is the solution:-
Q: A) Why is the conditional variance a good measure of uncertainty? B) Outline the GARCH model and…
A: The expectation of a random variable's squared deviation from its population mean or sample mean is…
Q: What does a project’s NPV of $1,500 mean?
A: The Net Present Value is excess of Present Value of Cash Inflow over Present Value of Cash Outflow.…
Q: A manufacturer of programmable calculators is attempting to determine a reasonable free-service…
A: a) Given Information: Time (T) = 30 months Mean time between failures (MTBF) = 30 months Following…
Q: hoose the best answer choice to identify the benefit(s) of simulation. a. Simulation can lead…
A: Simulation is the process of copying an existing system. The purpose of the simulation is to…
Q: Jankord Jewelers permits the return of their diamond wedding rings, provided the return occurs…
A: A performance appraisal is a review of an employee's performance and overall contribution to a…
Q: A company uses 85 circuit boards a day in a manufacturing process. The person who ordersthe boards…
A:
Q: An automobile manufacturer is concerned about a fault in the braking mechanism of a particular…
A: given, distribution number of cars per year =8 on average
Q: After meeting with the regional sales managers, Lauretta Anderson, president of Cowpie Computers,…
A: Given information: Sales Grow = 10% New operating System = 30% Sales increases = 10% Sales…
Q: A manager is simulating the number of times a machine operator stops a machine to make adjustments.…
A: ANSWER : No. of stops Probability Cumulative Probability Random no range 1 0.2 0.2 0.00 to <…
Q: Assuming the mean height of students in an exactly normal distribution to be 68.22 inches and…
A: All normal distributions can be converted into the standard normal curve by subtracting the mean and…
Q: Cassette tapes are still used in some handheld recording devices and in less expensive portable…
A: We have, deviation from target, d = 0.200 Loss amount due to deviation, L = $20 Target…
Q: The average number of phone calls to a call center on Thursday nights from 10:00 PM to 11:00 PM is…
A: For this given question, we know about the average number of calls that is here, 6.3, here, I have…
Q: A. Find the sample size. (Round up your answer to the next whole number.) B.How would you tell…
A: Given information: AQL=9% LTPD acceptable by the assembly department=44% Consumer's risk=10 percent…
Q: Cassette tapes are still used in some handheld recording devices and in less expensive portable…
A: Given information Desire speed = 1.900inches Cost of manufacturer = $20 Speed of the target =…
Q: A manager is simulating the number of times a machine operator stops a machine to make adjustments.…
A: ANSWER : Number of stops Probability Cumulative Probability RN range 1 0.2 0.2 0.00 to <…
Q: Which of the three variables in Little’s law do you think is generally the most difficult to…
A: Little's law is described as the theorem through which the average number of items that are present…
Q: What is the Eichleay Formula used for?
A: Answer: Eichleay Formula is used for solving the disputes created in Home Office overhead cost on…
Q: a.Find the expected value of the number of tests taken. b.Compute the variance and the standard…
A: Below is the solution
Q: A family of mutual funds maintains a service that allows clients to switch money among accounts…
A:
Q: TenTen Company manufactures video recorders. It is so certain of its quality control that it is…
A: May there be 4 states in the Markov chain. The main state U is that the recorder is in its first…
Q: Given this frequency distribution, what demand values would be associated with the following random…
A: Below is the solution:-
Q: Which one of the following is an example of a discrete variable? Number of Burgers sold by KFC O a.…
A: A discrete variable is a type of static variable that assumes only fixed number of distinct values…
Q: For a given perishable product, a retailer pays $5 for each unit, then sells them for $10 each. At…
A: Given that: Cost price for Retailer = $5 Selling price for retailer = $10 Salvage Value = $1 x…
Q: The preference of an agents on lotteries can be represented by an expected utility function u such…
A: B) risk Loving
Q: A negative value of Z in standard normal distribution indicates that a. the number of standard…
A: Since you have asked multiple questions, we will solve the first question for you. If you want any…
Q: Few companies take the time to estimate the value of a good customer (and often spend little effort…
A: Given information: Average spending during a visit = R Repurchase frequency = F Gross Profit margin…
Q: Discuss how likely it is that 70% of students will pass a college course with a B or an A. Then,…
A:
Q: A manager is simulating the number of times a machine operator stops a machine to make adjustments.…
A: ANSWER : No. of stops Prob CumProb RN Ranges 1 0.20 0.20 00 - 19 2 0.20 0.40 20 - 39 3 0.20…
Q: Consider a service system in which each entering customer must be served first by server 1, then by…
A: (a) Let X1 , X2 and X3 be the measure of time taken by worker 1, 2 and 3 individually. Likelihood…
Q: Nancy's psychology teacher will give her a course grade that is the maximum of her scores on two…
A: The answer to the given question is False
Q: 44. US Airlines receives an average of 500 calls per hourfrom customers who want to make…
A: The following information is provided: The arrival rate is 500/hr The service rate is 20/hr Wage…
Q: A Machine Costing P720,000 is estimated to have a book value of P40,545.73 when retired at the end…
A: Given data: BV = Book Value of Machine = P40,545.73 C = Cost of Machine = P720,000 r = Annual Rate…
Q: The director of research and development is testing a new drug. She wants to know if there is…
A: H0 : = 363
Q: Deborah Hollwager, a concessionaire for the Amway Center in Orlando, has developed a table of…
A: Given-
Q: An equipment which costs $15000 has to be replaced with a new equipment. The follovg data have been…
A: Find the given details below: Given details: Year Resale Value Annual maintenance cost 1…
Q: in any simulation model ,the service time, is considered: O a controllable input O a probabilistic…
A: The correct answer is
Q: c. The time in minutes, until a customer approaches a cashier in a grocery, has an exponential…
A: In Probability insights, the exponential distribution is a nonstop likelihood distribution that…


Trending now
This is a popular solution!

Step by step
Solved in 2 steps

- Based on Kelly (1956). You currently have 100. Each week you can invest any amount of money you currently have in a risky investment. With probability 0.4, the amount you invest is tripled (e.g., if you invest 100, you increase your asset position by 300), and, with probability 0.6, the amount you invest is lost. Consider the following investment strategies: Each week, invest 10% of your money. Each week, invest 30% of your money. Each week, invest 50% of your money. Use @RISK to simulate 100 weeks of each strategy 1000 times. Which strategy appears to be best in terms of the maximum growth rate? (In general, if you can multiply your investment by M with probability p and lose your investment with probability q = 1 p, you should invest a fraction [p(M 1) q]/(M 1) of your money each week. This strategy maximizes the expected growth rate of your fortune and is known as the Kelly criterion.) (Hint: If an initial wealth of I dollars grows to F dollars in 100 weeks, the weekly growth rate, labeled r, satisfies F = (I + r)100, so that r = (F/I)1/100 1.)You now have 10,000, all of which is invested in a sports team. Each year there is a 60% chance that the value of the team will increase by 60% and a 40% chance that the value of the team will decrease by 60%. Estimate the mean and median value of your investment after 50 years. Explain the large difference between the estimated mean and median.If you want to replicate the results of a simulation model with Excel functions only, not @RISK, you can build a data table and let the column input cell be any blank cell. Explain why this works.
- A common decision is whether a company should buy equipment and produce a product in house or outsource production to another company. If sales volume is high enough, then by producing in house, the savings on unit costs will cover the fixed cost of the equipment. Suppose a company must make such a decision for a four-year time horizon, given the following data. Use simulation to estimate the probability that producing in house is better than outsourcing. If the company outsources production, it will have to purchase the product from the manufacturer for 25 per unit. This unit cost will remain constant for the next four years. The company will sell the product for 42 per unit. This price will remain constant for the next four years. If the company produces the product in house, it must buy a 500,000 machine that is depreciated on a straight-line basis over four years, and its cost of production will be 9 per unit. This unit cost will remain constant for the next four years. The demand in year 1 has a worst case of 10,000 units, a most likely case of 14,000 units, and a best case of 16,000 units. The average annual growth in demand for years 2-4 has a worst case of 7%, a most likely case of 15%, and a best case of 20%. Whatever this annual growth is, it will be the same in each of the years. The tax rate is 35%. Cash flows are discounted at 8% per year.Software development is an inherently risky and uncertain process. For example, there are many examples of software that couldnt be finished by the scheduled release datebugs still remained and features werent ready. (Many people believe this was the case with Office 2007.) How might you simulate the development of a software product? What random inputs would be required? Which outputs would be of interest? Which measures of the probability distributions of these outputs would be most important?Suppose you simulate a gambling situation where you place many bets. On each bet, the distribution of your net winnings (loss if negative) is highly skewed to the left because there are some possibilities of really large losses but not much upside potential. Your only simulation output is the average of the results of all the bets. If you run @RISK with many iterations and look at the resulting histogram of this output, what will it look like? Why?
- Assume that all of a companys job applicants must take a test, and that the scores on this test are normally distributed. The selection ratio is the cutoff point used by the company in its hiring process. For example, a selection ratio of 25% means that the company will accept applicants for jobs who rank in the top 25% of all applicants. If the company chooses a selection ratio of 25%, the average test score of those selected will be 1.27 standard deviations above average. Use simulation to verify this fact, proceeding as follows. a. Show that if the company wants to accept only the top 25% of all applicants, it should accept applicants whose test scores are at least 0.674 standard deviation above average. (No simulation is required here. Just use the appropriate Excel normal function.) b. Now generate 1000 test scores from a normal distribution with mean 0 and standard deviation 1. The average test score of those selected is the average of the scores that are at least 0.674. To determine this, use Excels DAVERAGE function. To do so, put the heading Score in cell A3, generate the 1000 test scores in the range A4:A1003, and name the range A3:A1003 Data. In cells C3 and C4, enter the labels Score and 0.674. (The range C3:C4 is called the criterion range.) Then calculate the average of all applicants who will be hired by entering the formula =DAVERAGE(Data, "Score", C3:C4) in any cell. This average should be close to the theoretical average, 1.27. This formula works as follows. Excel finds all observations in the Data range that satisfy the criterion described in the range C3:C4 (Score0.674). Then it averages the values in the Score column (the second argument of DAVERAGE) corresponding to these entries. See online help for more about Excels database D functions. c. What information would the company need to determine an optimal selection ratio? How could it determine the optimal selection ratio?Assume a very good NBA team has a 70% chance of winning in each game it plays. During an 82-game season what is the average length of the teams longest winning streak? What is the probability that the team has a winning streak of at least 16 games? Use simulation to answer these questions, where each iteration of the simulation generates the outcomes of all 82 games.The customer loyalty model in Example 11.9 assumes that once a customer leaves (becomes disloyal), that customer never becomes loyal again. Assume instead that there are two probabilities that drive the model, the retention rate and the rejoin rate, with values 0.75 and 0.15, respectively. The simulation should follow a customer who starts as a loyal customer in year 1. From then on, at the end of any year when the customer was loyal, this customer remains loyal for the next year with probability equal to the retention rate. But at the end of any year the customer is disloyal, this customer becomes loyal the next year with probability equal to the rejoin rate. During the customers nth loyal year with the company, the companys mean profit from this customer is the nth value in the mean profit list in column B. Keep track of the same two outputs as in the example, and also keep track of the number of times the customer rejoins.
- Simulation can be used to illustrate a number of results from statistics that are difficult to understand with nonsimulation arguments. One is the famous central limit theorem, which says that if you sample enough values from any population distribution and then average these values, the resulting average will be approximately normally distributed. Confirm this by using @ RISK with the following population distributions (run a separate simulation for each): (a) discrete with possible values 1 and 2 and probabilities 0.2 and 0.8; (b) exponential with mean 1 (use the RISKEXPON function with the single argument 1); (c) triangular with minimum, most likely, and maximum values equal to 1,9, and 10. (Note that each of these distributions is very skewed.) Run each simulation with 10 values in each average, and run 1000 iterations to simulate 1000 averages. Create a histogram of the averages to see whether it is indeed bell-shaped. Then repeat, using 30 values in each average. Are the histograms based on 10 values qualitatively different from those, based on 30?Big Hit Video must determine how many copies of a new video to purchase. Assume that the companys goal is to purchase a number of copies that maximizes its expected profit from the video during the next year. Describe how you would use simulation to shed light on this problem. Assume that each time a video is rented, it is rented for one day.Based on Babich (1992). Suppose that each week each of 300 families buys a gallon of orange juice from company A, B, or C. Let pA denote the probability that a gallon produced by company A is of unsatisfactory quality, and define pB and pC similarly for companies B and C. If the last gallon of juice purchased by a family is satisfactory, the next week they will purchase a gallon of juice from the same company. If the last gallon of juice purchased by a family is not satisfactory, the family will purchase a gallon from a competitor. Consider a week in which A families have purchased juice A, B families have purchased juice B, and C families have purchased juice C. Assume that families that switch brands during a period are allocated to the remaining brands in a manner that is proportional to the current market shares of the other brands. For example, if a customer switches from brand A, there is probability B/(B + C) that he will switch to brand B and probability C/(B + C) that he will switch to brand C. Suppose that the market is currently divided equally: 10,000 families for each of the three brands. a. After a year, what will the market share for each firm be? Assume pA = 0.10, pB = 0.15, and pC = 0.20. (Hint: You will need to use the RISKBINOMLAL function to see how many people switch from A and then use the RISKBENOMIAL function again to see how many switch from A to B and from A to C. However, if your model requires more RISKBINOMIAL functions than the number allowed in the academic version of @RISK, remember that you can instead use the BENOM.INV (or the old CRITBENOM) function to generate binomially distributed random numbers. This takes the form =BINOM.INV (ntrials, psuccess, RAND()).) b. Suppose a 1% increase in market share is worth 10,000 per week to company A. Company A believes that for a cost of 1 million per year it can cut the percentage of unsatisfactory juice cartons in half. Is this worthwhile? (Use the same values of pA, pB, and pC as in part a.)