If I attend 3 more tutorials, what impact do I expect this to have on my final mark? The R2 value for the model fit was 0.11. Write a sentence about what this represents with respect to the data.
If I attend 3 more tutorials, what impact do I expect this to have on my final mark? The R2 value for the model fit was 0.11. Write a sentence about what this represents with respect to the data.

College Algebra
7th Edition
ISBN:9781305115545
Author:James Stewart, Lothar Redlin, Saleem Watson
Publisher:James Stewart, Lothar Redlin, Saleem Watson
Chapter1: Equations And Graphs
Section: Chapter Questions
Problem 10T: Olympic Pole Vault The graph in Figure 7 indicates that in recent years the winning Olympic men’s...

Related questions
Question
-
If I attend 3 more tutorials, what impact do I expect this to have on my final mark?
-
-
The R2 value for the model fit was 0.11. Write a sentence about what this represents with respect to the data.
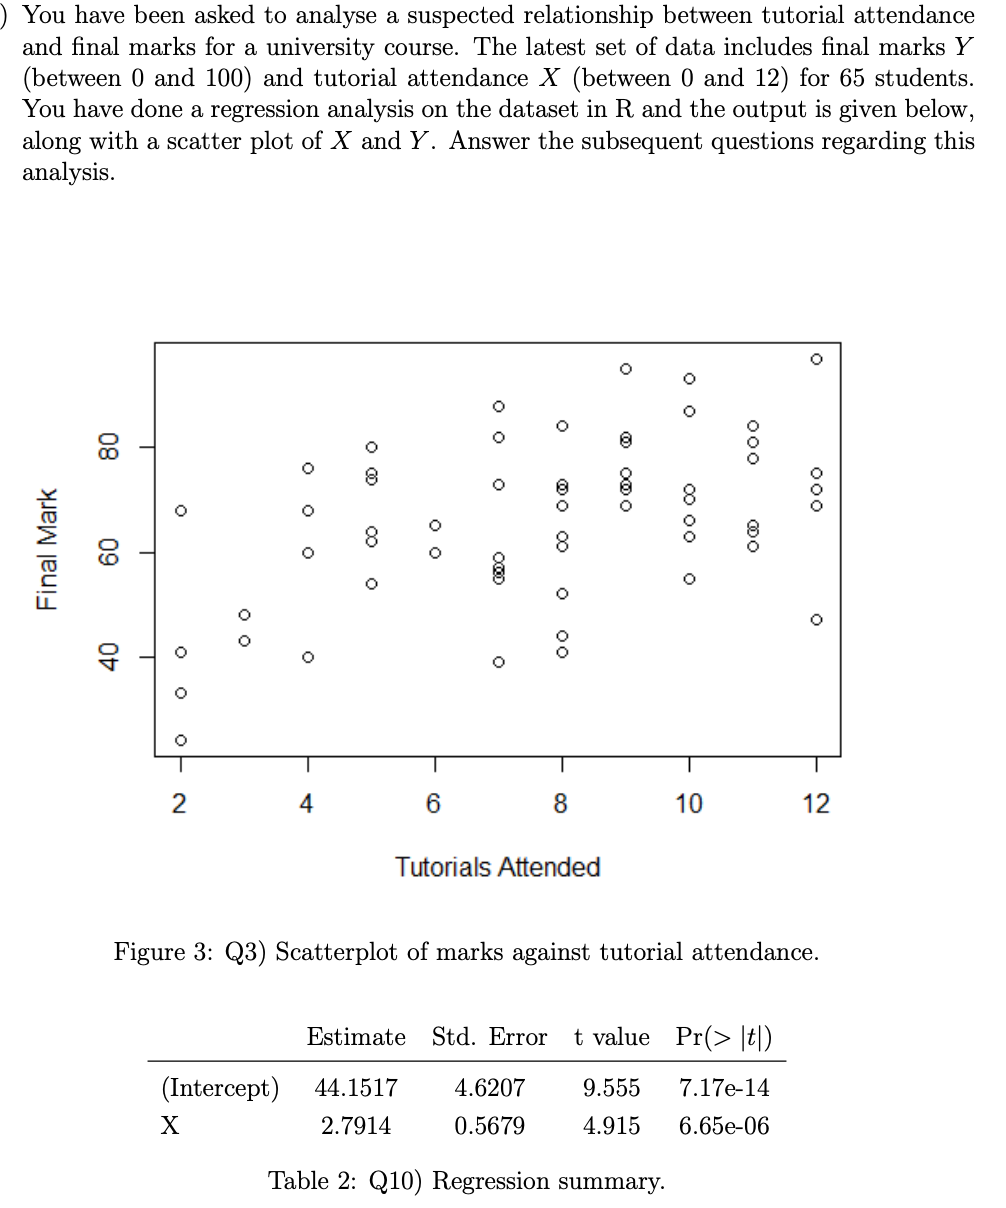
Transcribed Image Text:You have been asked to analyse a suspected relationship between tutorial attendance
and final marks for a university course. The latest set of data includes final marks Y
(between 0 and 100) and tutorial attendance X (between 0 and 12) for 65 students.
You have done a regression analysis on the dataset in R and the output is given below,
along with a scatter plot of X and Y. Answer the subsequent questions regarding this
analysis.
80
Final Mark
60
40
T
T
o
O
0 0
00
O
O
o o
0 0 0
@0 00
0 00
O
ο απο
00
00 00
O
000
O®
ooo
o
2
4
6
8
10
12
Tutorials Attended
Figure 3: Q3) Scatterplot of marks against tutorial attendance.
Estimate Std. Error t value Pr(> |t|)
(Intercept)
44.1517
4.6207
9.555 7.17e-14
X
2.7914
0.5679
4.915 6.65e-06
Table 2: Q10) Regression summary.
Transcribed Image Text:2
1
Standardized residuals
-1
-2
0
00
039
081
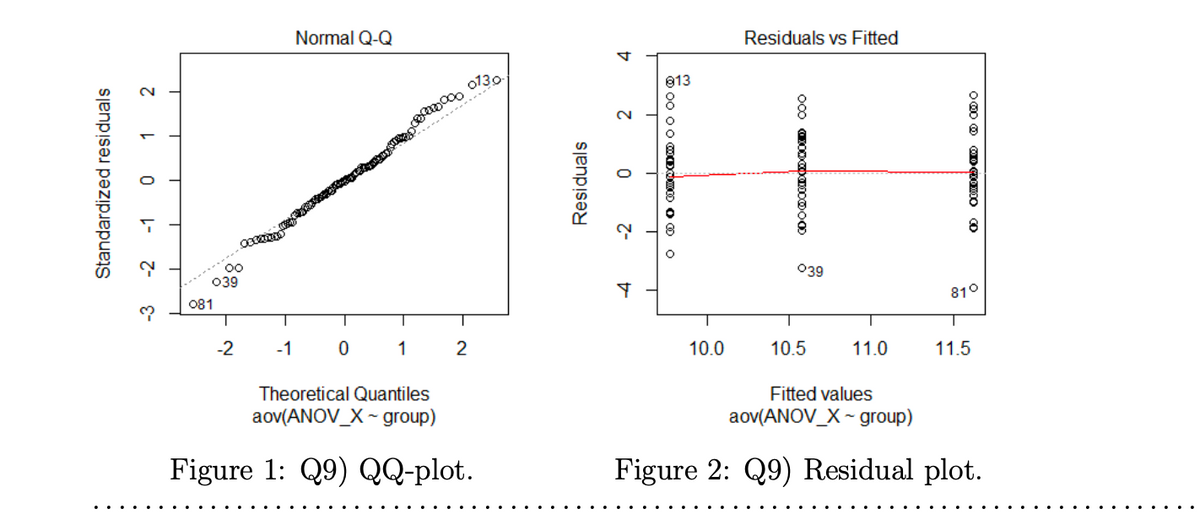
Normal Q-Q
-2
000000000 0730.
2
-1
0
1
Theoretical Quantiles
aov(ANOV_X~ group)
Figure 1: Q9) QQ-plot.
Residuals
4
2
T
@oooo @DO O O
000 @xxxxxxxxxx@
0
000 ORDEIDO CO
-2
@13
-4
Residuals vs Fitted
10.0
039
11.0
10.5
11.5
Fitted values
aov(ANOV_X~ group)
Figure 2: Q9) Residual plot.
810
Expert Solution
This question has been solved!
Explore an expertly crafted, step-by-step solution for a thorough understanding of key concepts.

Step by step
Solved in 2 steps with 1 images

Recommended textbooks for you
College Algebra
Algebra
ISBN:
9781305115545
Author:
James Stewart, Lothar Redlin, Saleem Watson
Publisher:
Cengage Learning

Glencoe Algebra 1, Student Edition, 9780079039897…
Algebra
ISBN:
9780079039897
Author:
Carter
Publisher:
McGraw Hill
College Algebra
Algebra
ISBN:
9781305115545
Author:
James Stewart, Lothar Redlin, Saleem Watson
Publisher:
Cengage Learning
Glencoe Algebra 1, Student Edition, 9780079039897…
Algebra
ISBN:
9780079039897
Author:
Carter
Publisher:
McGraw Hill