If the histogram of a sample is skewed to the left, then the sample mean is median. than the sample O Cannot be determined O greater than O less than O equal to
If the histogram of a sample is skewed to the left, then the sample mean is median. than the sample O Cannot be determined O greater than O less than O equal to

Algebra & Trigonometry with Analytic Geometry
13th Edition
ISBN:9781133382119
Author:Swokowski
Publisher:Swokowski
Chapter10: Sequences, Series, And Probability
Section10.8: Probability
Problem 30E

Related questions
Question
11
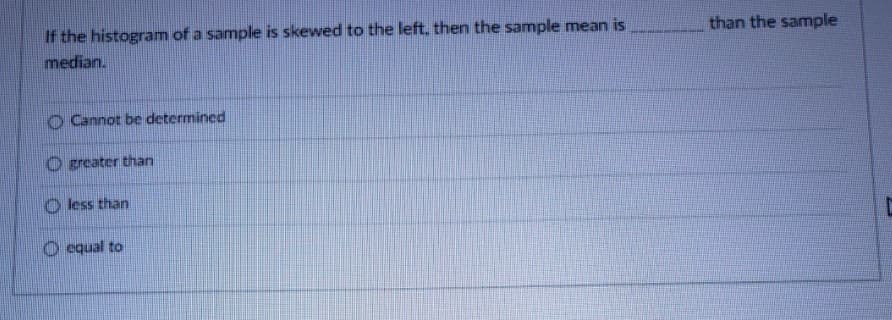
Transcribed Image Text:If the histogram of a sample is skewed to the left, then the sample mean is
than the sample
median.
O Cannot be determined
O greater than
O less than
O equal to
Expert Solution
This question has been solved!
Explore an expertly crafted, step-by-step solution for a thorough understanding of key concepts.

Step by step
Solved in 2 steps

Recommended textbooks for you
Algebra & Trigonometry with Analytic Geometry
Algebra
ISBN:
9781133382119
Author:
Swokowski
Publisher:
Cengage

Glencoe Algebra 1, Student Edition, 9780079039897…
Algebra
ISBN:
9780079039897
Author:
Carter
Publisher:
McGraw Hill
Algebra & Trigonometry with Analytic Geometry
Algebra
ISBN:
9781133382119
Author:
Swokowski
Publisher:
Cengage
Glencoe Algebra 1, Student Edition, 9780079039897…
Algebra
ISBN:
9780079039897
Author:
Carter
Publisher:
McGraw Hill