If X and Y are`two regression lines with equal mean and if 1- a Y= aX + b and X = aY+ B. Prove that and also %3D %3D B1-a find out the joint mean of two variables.
If X and Y are`two regression lines with equal mean and if 1- a Y= aX + b and X = aY+ B. Prove that and also %3D %3D B1-a find out the joint mean of two variables.

Trigonometry (MindTap Course List)
8th Edition
ISBN:9781305652224
Author:Charles P. McKeague, Mark D. Turner
Publisher:Charles P. McKeague, Mark D. Turner
Chapter4: Graphing And Inverse Functions
Section: Chapter Questions
Problem 6GP: If your graphing calculator is capable of computing a least-squares sinusoidal regression model, use...

Related questions
Question
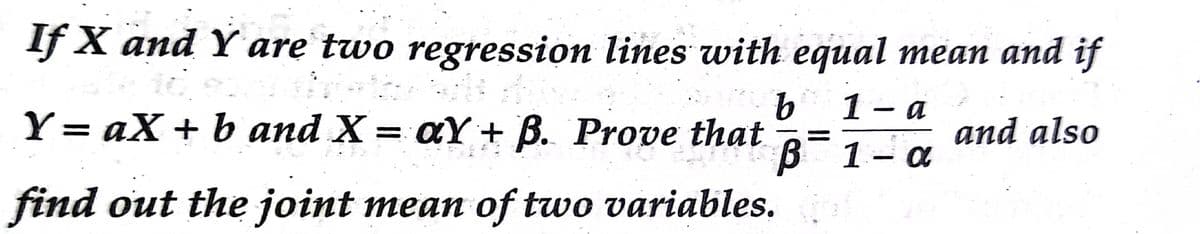
Transcribed Image Text:If X and Y are two regression lines with equal mean and if
1- a
Y= aX + b and X = aY+ B. Prove that
B
find out the joint mean of two variables.
and also
1- a
Expert Solution
This question has been solved!
Explore an expertly crafted, step-by-step solution for a thorough understanding of key concepts.

Step by step
Solved in 2 steps with 2 images

Recommended textbooks for you
Trigonometry (MindTap Course List)
Trigonometry
ISBN:
9781305652224
Author:
Charles P. McKeague, Mark D. Turner
Publisher:
Cengage Learning

Algebra & Trigonometry with Analytic Geometry
Algebra
ISBN:
9781133382119
Author:
Swokowski
Publisher:
Cengage

College Algebra
Algebra
ISBN:
9781305115545
Author:
James Stewart, Lothar Redlin, Saleem Watson
Publisher:
Cengage Learning
Trigonometry (MindTap Course List)
Trigonometry
ISBN:
9781305652224
Author:
Charles P. McKeague, Mark D. Turner
Publisher:
Cengage Learning
Algebra & Trigonometry with Analytic Geometry
Algebra
ISBN:
9781133382119
Author:
Swokowski
Publisher:
Cengage
College Algebra
Algebra
ISBN:
9781305115545
Author:
James Stewart, Lothar Redlin, Saleem Watson
Publisher:
Cengage Learning