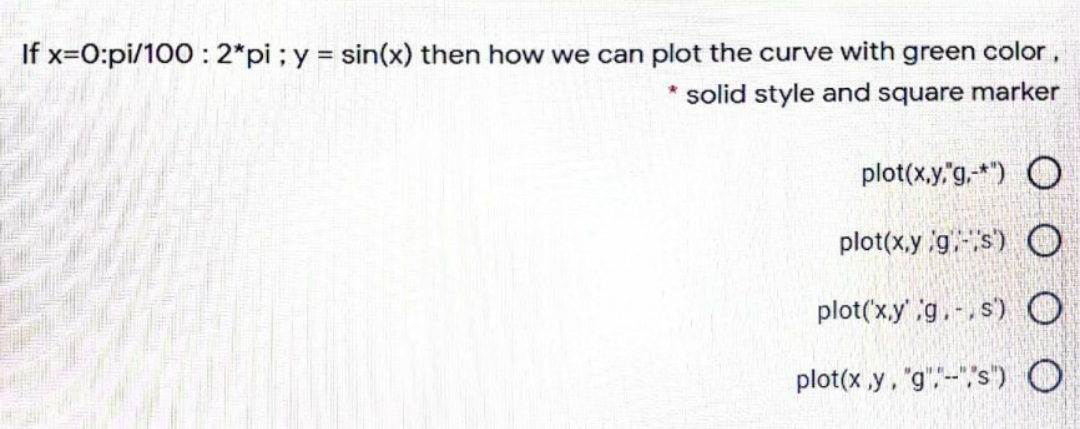
If x=0:pi/100 : 2*pi ;y = sin(x) then how we can plot the curve with green color, solid style and square marker plot(x,y,"g.-*") O plot(x.y g.s) O plot('x.y'g.-,s)O plot(x ,y, "g",--","s") O


Q: The purpose of this assignment is to use Python to merge several photographic elements into a single…
A: The purpose of this assignment is to use Python to merge several photographic elements into a single…
Q: Write a program that uses scroll bars or slidersto select the color for a text, as shown in Figure .…
A: The following program is written in Java programming language. Save the program code with…
Q: What is the mathematical statement of the following, using the following statements on the image? 4.…
A: Below is the answer to above question. I hope this will be helpful for you..
Q: Upsampling an Image using Interpolation Techniques There are a number of techniques that can be used…
A: Solution: What is image interpolation? I. An image f(x,y) tells us the intensity values at the…
Q: Draw an equilateral triangle with sides of 100 pixels starting at the origin having sides of 100…
A: import turtle; #importing turtle triangle=turtle.Turtle(); #creating turtle #for side1…
Q: Rohan bought a gallon of milk with an original price of $4.25; today he gets a 15% discount before a…
A: price = 4.25discount = 15tax = 5 # after discount priceprice = price - price * discount/100 #Final…
Q: The three simplest gates are
A: The three simplest gates are:
Q: To prepare the drawing to display .2 :on the screen we use gluOrtho2D (GLdouble left, GLdouble…
A: Given - To prepare the drawing to display on the screen we use the different commands in OpenGL.…
Q: Plasma Effect: Plasma effects are often used to create wobbly animations in demo products like…
A: Answer:
Q: please find the area of a triangle in 2 ways given the points A, B, and C. Plot the points A=…
A: The solution for the above-given question is given below:
Q: .• 3. Rearrange these lines of code to construct a square, then another square that touches the…
A:
Q: - color: String Circle() -Circle(color:String, radius:doU getRadius(): double setRadius(radius:…
A: 1- In this assignment require, default constructor, parameterized constructor, getter method, setter…
Q: Two products are sold from a vending machine, which has two push buttons P, and P. When a button is…
A: Introduction :P1 and P2 variables are given , when button is pressed price shown in the 7-segment…
Q: TestCircle• Create a Circle with the radius• Print the radius using the getters• Print the Circle’s…
A: The given criteria is written in Java programming language.
Q: x= [0:0.01:1]; yl= sin(4 pi * var); y2 = cos(3 * pi * var); plot(x, y1); hold on; plot(x, y2, 'r');…
A: The plot function draws or creates a 2-D line plot of data set Y against Data set X over a graph. In…
Q: Randomly generate a number in range [1, 12]. Map this number to a season: if the number is 3, 4, or…
A: Programming Language => PYTHON I have provided PYTHON CODE along with CODE SCREENSHOT…
Q: We can remove / hide border of a . shape by selecting No Line O White Line O No Border O No Outline…
A: 1. We can remove/hide border of a shape by selecting Ans: No Outline Wrong options are No line…
Q: Given a window with lower left corner of (10,30), and upper right corner of (60,60), and viewpoint…
A: Let's see what are we given, For window, Xwmin = 10, Xwmax = 60, Ywmin = 30, Ywmax = 60.For…
Q: In this exercise you will use an Ultrasonic Distance Sensor and a Seven-Segment Display. We check…
A: The program is written in C Language. Check the program screenshot for the correct indentation.…
Q: Change your code below to create a pattern using nested loops. Your initial needs to appear at…
A: The program is implemented in python with procedural approach. The program prints the initials of…
Q: Constant Real GRAVITY = 9.81 Display "Rates of acceleration of an objet in free fall:" Display…
A: Answer: Declare Real pi Set pi 3.14159265 Display "The value of pi is ", pi # Correct the following…
Q: ou can publish your visualization via Tableau online, Tableau Server and Tableau Public. Group of…
A: Required: You can publish your visualization via Tableau online, Tableau Server and Tableau Public.…
Q: The correct choice to draw lines from point (160,120) to point (160,250) is 40,250 160,250 260,250…
A: Your answer is given below.
Q: Lab #8 – Crazy Pet Store Background: The local pet store has 35 different bowls with fish in them…
A: Hey there, I am writing the required solution based on the above given question. Please do find the…
Q: In this exercise you will use an Ultrasonic Distance Sensor and a Seven-Segment Display. We check…
A: Ultrasonic sensor and 7 Segment Display Interfacing int pin[9] = {2,3,4,5,6,7,8,A0,A1};//…
Q: Accept the two sides and an angle included by these two sides, and find the area and third side of a…
A: Accept the two sides and an angle included by these two sides, and find the area and third side of a…
Q: def get_line(board: str, dir: str, col_or_row: int) ->
A: <?php// PHP program to check whether a given // tic tac toe board is valid or not // This matrix…
Q: The following program rotates a cube with mouse clicks. In the display callback, the Lookat function…
A: #include <stdlib.h>#include <GL/glut.h> GLfloat vertices[][3] =…
Q: Consider hiding the t ber-andoher ace u-ae peple a actively veng n meda youde hesta ber beto pelee…
A: Answer :- HTML Code :- <div id=“container"> <div class="bg bg1"></div> <div…
Q: This method returns a string where a triangle appears on the left size of the diagram, followed by…
A: The ask is to write a method which would display the shown pattern.
Q: A text box can be inserted into an image using a group of text correct Error O
A: Answer: A text box can be inserted into an image using a group of text correct A paragraph…
Q: Write htmi code for the given image. Create a div having background-color = red. =
A:
Q: Using code in C u can open image in new tab so can you can see clearly because I can only post 2…
A: #include<stdio.h> #include<string.h> #include< windows.h> void play(); void(); int…
Q: unction [ ] = square_spectrum( L,N ) %Activity 1 for CEN415 Summer 2022 x=linspace(0,2*L,200);…
A: The graph is given below
Q: Write an algorithm that outline how to calculate the room area for the image below
A: #include<bits/stdc++.h> using namespace std; int main(){ float a,b,c,d,e;…
Q: This method returns a string where a triangle appears on the left size of the diagram, followed by…
A: Required: A method returns a string where a triangle appears on the left size of the diagram,…
Q: image shows the final result but I just want to know how we get there
A: Stop=10 Result=0 when a=0: Print a: i.e print 0: When b=0 => result = result+a+b =…
Q: A unit square is shown below. What will be the image of unit square after horizontal and vertical…
A: We have the following graph in which we have to find out the vertical and horizontal expansion. 1)…
Q: roup of answer choices 5 6 7 8
A: Lets see the solution.
Q: Description of animation In informal language, here is an example description of the animation for…
A: A picture is worth a thousand words, and moving pictures are worth many more. Pictures and moving…
Q: Draw a cartoon character using lines and shapes. Apply colors. Feel free to use the following…
A: Please find the code below in step 2
Q: Scaling by a fraction move the point closer to the origin True or false
A: Scaling by a fraction move the point closer to the origin
Q: my_turtle.penup() my_turtle.goto(polygon_points [0] [0],polygon_points[0][1]) my_turtle.pendown ( )…
A: import turtle t = turtle.Turtle() def draw_filled_subregion(my_turtle,polygon_points,style,votes):…
Q: Circumference of a circle = C = 2ar Volume of a cylinder=V=rr*h Area of a cylinder A = 2arh+2r?…
A: Here we have to create the three classes. The first one will be circle having only field as radius…
Q: A hospital would like to visualize the count of patients they have per disease type. The disease…
A: I have answered the question in step 2.
Q: Submit your code solution in .asm files. Please also submit a screenshot showing that you ran the…
A: Answer is written below ?
Q: python using numpy as np, matplotlib.pyplot as plt create an new image consisting of a 2×2 grid with…
A: It is defined as a powerful general-purpose programming language. It is used in web development,…
Q: 1. Let's go bowling! Ask your user if they want to play 5 or 10 pin bowling, then print out a '"*"…
A: Answer: Java Source Code: import java.util.*;public class Main { public static void main(String[]…
Q: What does the following Pygame code draw?…
A: Introduction: To Draw a Polygon: pygame.draw.polygon(surface, colour, points, width) # width is…

Step by step
Solved in 2 steps with 1 images


- how would i turn this erd into a code for example it should look something like the second photo and first one is the erd(Please do not give solution in image format thanku) Using Java, Integer variables totalBudget and productCost are read from input. A product costs productCost to make, and a budget is given by totalBudget. Assign remainingBudget with the remaining budget after making as many products as possible.TestCircle• Create a Circle with the radius• Print the radius using the getters• Print the Circle’s area and circumference• Change the circle’s radius• Reprint the information
- Write a program that uses scroll bars or slidersto select the color for a text, as shown in Figure . Four horizontal scrollbars are used for selecting the colors: red, green, blue, and opacity percentages.Using code in C u can open image in new tab so can you can see clearly because I can only post 2 images SONGS LIST IDGAF - Dua LipaFRIENDS - Marshmello, Anne-MarieThe Middle - Zedd, Maren Morris, GreyBest Part - H.E.R., Daniel CaesarAll The Stars (with SZA) - Kendrick Lamar, LZAWolves - Selena Gomez, MarshmelloGod's Plan - DrakeRewrite The Stars - Zac Efron, ZendayaHavana - Camila Cabello, Young ThugPerfect - Ed SheeranDraw a wall with "irregular wavy color bands". Hint: you can use curveVertex and random functions in p5js library. Note: You should use loops to draw the lines, not manually write 50-100 line functions How would i answer this question using the code below: function setup() { createCanvas(350, 350); } function draw() { background(200); background('blue'); noFill(); //this will run a loop form -20 to fill the whole canvas for(let y=-20; y<300; y+=4){ beginShape(); Stroke("yelllow"); //now to link point to point in curve //y is height curveVertex(0, y+0); curveVertex(0, y+20); curveVertex(50, y+0); curveVertex(100, y+20); curveVertex(150, y+0); curveVertex(200, y+20); curveVertex(250, y+0); curveVertex(300, y+20); curveVertex(350, y+0); curveVertex(400, y+0); endShape(); } } Subject: Java Programming
- Make the photo below into a grayscale using python. Let us assume that the photo below is located in a folder name 'pic' and the name of the photo is Bird.jpgCode for gray: def grayscale(image): for y in range(image.getHeight()): for x in range(image.getWidth()): (r, g, b) = image.getPixel(x, y) r = int(r * 0.299) g= int(g * 0.587) b = int(b * 0.114) lum = r + g + b image.setPixels(x, y, (lum, lum, lum))I cant seem to get this code to work. It is supposed to be a card game where I draw for me then for the computer: from Button import Buttonimport random ranks = ["2", "3", "4", "5", "6", "7", "8", "9", "10", "J", "Q", "K", "A"]suits = ["Spades", "Hearts", "Diamonds", "Clubs"] image_filenames = ["spade.png", "heart.png", "diamond.png", "club.png"] images = []blank_image = None player_one_suit = Noneplayer_two_suit = Noneplayer_one_rank = "-"player_two_rank = "-" game_result = "" btn = None def cut(): rank = random.choice(ranks) suit_index = random.randrange(4) return rank, suit_index def setup(): global btn, images, blank_image global player_one_rank, player_two_rank, player_one_suit, player_two_suit for i in range(len(image_filenames)): images.append(loadImage(image_filenames[i])) images[i].resize(50,50) blank_image = loadImage("blank.png") player_one_suit = blank_image player_two_suit = blank_image size(400,400) btn =…Please answer all the questions int the image
- Please do not give solution in image format thanku Flappy Bird We have a red dot flapping through a maze of “pipes” (green vertical lines). Press the button and the dot goes up, release the button and the dot goes down. You need to also keep track of the score, which will be a decimal value of up to at least 999, shown on the hex displays of the board. The project will be done with Verilog and FPGA Describe the project from a user standpoint: what it does, how the user will interact with it (be specific; think about what I/O they will use to move left or right), etc. Include a top-level block diagram. This needs to be detailed enough that we can understand how the different blocks of the system interact, but does not have to be super complex.Java Question - (Has 2 Parts). Based on each code, which answer out of the choices "A, B, C, D, E" is correct. Each part has one correct answer. Thank you. Part 1 - Which can nullify a JPanel’s layout manager? A. pane1.setLayout(void);B. pane1.setLayout(no);C. pane1.setLayout(false);D. pane1.setLayout();E. pane1.setLayout(null); Part 2 - Which can set the background color of "panel1" to red? A. panel1.setBackground(red);B. panel1.setBackgroundColor(red);C. panel1.setBackground(Color) = "red";D. panel1.setBackground(Color.red); E. panel1.setBackground = Color.red;For example, the card 3♦ will be represented as ("Diamond", "3").