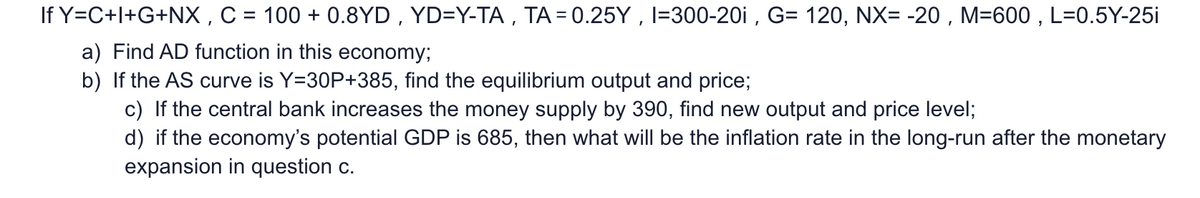
If Y=C+l+G+NX , C = 100 + 0.8YD , YD=Y-TA , TA = 0.25Y , I=300-20i , G= 120, NX= -20 , M=600 , L=0.5Y-25i a) Find AD function in this economy; b) If the AS curve is Y=30P+385, find the equilibrium output and price; c) If the central bank increases the money supply by 390, find new output and price level; d) if the economy's potential GDP is 685, then what will be the inflation rate in the long-run after the monetary expansion in question c.


Q: increase in government spending on AE, IS, and AD
A: (i) Keynesian cross Increase in government spending increases aggregate expenditure (AE), which…
Q: Assume that the full-employment level of output is $1,000 and the price level associated with…
A: The expenditure multiplier effect measures the impact that a change in autonomous spending will have…
Q: Show that the implied Marshallian demand curves are:
A: For finding implied Marshallian demand curves, we will use lagrange method. L = U(x,y) - λ(p1x1 +…
Q: Identify the effect of tax incentives for saving on aggregate supply using the model of the…
A: Answer to the question is as follows:
Q: Which of the following statements is false? The larger the expenditure multiplier, the steeper…
A: The IS Curve represents different combinations of interest rates and income combinations along which…
Q: Consider the following IS-LM model: C = 201 +0.48YD /= 140+0.18Y-1,187/ G = 306 T = 245 i = 0.06 The…
A: IS-LM model is used to determine equilibrium GDP and equilibrium interest rate.
Q: An increase in AD will primarily increase the price level when the economy is on the steep part of…
A: The aggregate demand is the summation of the demand from all the economic agents such as the…
Q: The following is an aggregate demand and aggregate supply model. ASLA AS2 AS, P3 P2 AD2 AD1 Q, Real…
A: “Since you have posted a question with multiple sub-parts, we will solve first three sub-parts for…
Q: If the MPC is 0.80 and there are no crowding-out or accelerator effects, then an initial increase in…
A: A multiplier effect results in increase in the level of equilibrium national income to be greater…
Q: Refer to the graphs, in which the numbers in parentheses near the AD1, AD2, and AD3 labels indicate…
A: Aggregate demand: The quantity of products and services sought in an economy at a particular price…
Q: Suppose that the production function for the economy is given by: Y = AL/3K/3 Suppose that this…
A: Aggregate demand is the total demand of the economy and aggregate supply is the total supply of…
Q: The aggregate demand curve shifts to the left by $50 million. Assuming that the aggregate supply…
A: These aggregate demand shifters include anything that will manipulate the levels of Consumption,…
Q: Suppose that in May 2023, policymakers undertake the type of policy that is necessary to bring the…
A: It is a term used in economics to describe a recession that affects a specific geographic area. For…
Q: Drive the AD (Aggregate Demand) curve using the following: IS curve is given as Y = 20XX-100i, LM1…
A: Aggregate demand is the sum of consumption expenditure, investment expenditure, government…
Q: How would you define price stickiness? How does this phenomenon lead to an increase in the short run…
A: Price stickiness is the situation in which price adjusts by itself and stays same for a certain…
Q: False In the long- run, the level of output is independent of the price level O True False An…
A: NOTE: Since you have asked multiple questions we will be answering only the first one, if you need…
Q: Assume the following model of the closed economy in the short run, with the price level (P) fixed at…
A: Since you have provided multiple sub-parts questions, we will solve the first three subparts for…
Q: QE = equilibrium output QF = full employment rate of output Which option represents the AD…
A: The Aggregate demand shortfall leads to the fall in the output and employments. The equilibrium is…
Q: A. What would happen on the As-AD model if the government put forward and pass a $2 trillion…
A: (Since you have a posted a question with multiple sub-parts, we will solve the first three sub-part…
Q: To answer some parts of this question, you may need to refer to the diagram displayed below. The…
A: The given graph shows three aggregate demand curves and three aggregate supply curves with the…
Q: Draw AS/AD curve with the initial curves represented with AS0 and AD0 and the equilibrium with point…
A: Since you have posted a question with multiple sub-parts, we will solve first three subparts for…
Q: If the MPC is 0.80 and there are no crowding-out or accelerator effects, then an initial increase in…
A: According to the question, MPC is given as 0.8 and the aggregate demand is increased by $100 bn. On…
Q: Suppose that the components of planned spending in an economy are C-500 +0.8(Y-T), I-1500, G-2000,…
A: Given C = 500 + 0.8(Y - T) I = 1500 G = 2000 X = 0 T = 0.25Y
Q: Assume the Pakistan’s economy is in recession:Pakistan implements a combination of expansionary…
A: Solution: Crowding out: It is a situation in which an increase in interest rate leads to decrease in…
Q: In an AD/AS model, the point where the economy has excess capacity is called the: (A) Keynesian…
A: Aggregate supply is flatter in Keynesian zone, upward sloping in intermediate zone and steeper in…
Q: Suppose that in April 2023, policymakers undertake the type of policy that is necessary to bring the…
A: In first Paragraph 1.) Recession is coming when two consecutive quarters of decline in GDP.…
Q: Refer to Figure 16-1. Suppose the economy is in short-run equilibrium below potential GDP and no…
A: The gap that depicts when the real actual level of output is less than the potential level of output…
Q: can you tell me if these answers are correct? they are true/false. 6) increases in AS reduce the…
A: 6) Increases in AS reduce the rate of unemployment until you reach Qfe: The above diagram shows the…
Q: Consider starting from full-employment equilibrium in our Aggregate Demand and Supply model (with…
A: In the long run supply curve is vertical line at full employment level where it doesn't change deu…
Q: Suppose the AS curve is P = 4 Q + 10 and the AD curve is P = 100-4 Q. What is the equilibrium…
A: Answer to the question is as follows:
Q: The horizontal segment of the Keynesian aggregate supply curve: A.depicts a negative relationship…
A: Aggregate supply is the output of goods which all firm of an economy is able to supply in a market…
Q: The U.S. economy is initially in short-run macro-equilibrium. Assume oil prices fall. As a result,…
A: When an economy reaches its short run equilibrium, its aggregate demand and aggregate supply. We…
Q: Suppose that the production function for the economy is given by: Y = AL²/3K/3 Suppose that this…
A: Dear learner you have posted a question with multiple sub parts, as per our policy we have solved…
Q: 29. Assuming Aggregate Demand and Aggregate Supply are initially at ADo and ASo respectively, and…
A: Answer - Need to find- Assuming Aggregate Demand and Aggregate Supply are initially at ADo and ASo…
Q: In an economy with lump-sum taxes and no international trade, if the marginal propensity to consume…
A: In Keynesian economics, the change in aggregate demand is able to affect the output level and…
Q: The graph below depicts a decrease in aggregate demand due to a decrease in gross investment. This…
A:
Q: In an AD/AS model, the point where the economy has excess capacity is called the: (A) Keynesian zone…
A: In the AD/ AS model, there are three zones, Keynesian zone, intermediate and neoclassical zone.
Q: Refer to the information provided in Figure below to answer the question that follow. AS Price…
A: d. AD3 to AD4
Q: Question : AS and AD Discuss the impact of an increase in TFP on the economy on potential…
A: Increase in the total factor productivity (TFP) allows the firm to produce higher output with the…
Q: can you tell me if these answers are correct? they are true/false. 14) Crowding out, when it…
A: Fiscal policy is the use of government spending or tax to influence the macroeconomic condition. It…
Q: Q9. For each of the following sets of data, determine if output will need to increase, decrease, or…
A: 100300
Q: With respect to the IS/LM model, which of the following statements is false? Interest…
A: IS-LM model was developed by John Hicks and also known as Hicks-Hansen model. IS in this model…
Q: Suppose that in 2008, Sanaton’s government increases taxes. Show how this event will change…
A: If the government increases taxes, the supply would decrease and the SRAS would shift leftwards. It…
Please answer the all parts don't leave last part please it's a request.
Thank you

Step by step
Solved in 2 steps


- Given the following information: - The economy is in the long-run equilibrium. - The Fundamental Equation of Monetarism is true. - The income velocity of money is constant and the money supply is fixed: v=0.15 M=5600 - The production function is Y=F (L,K) = 8×√L×√K - The endowment of resources is given by the input combination (L,K) = (49,25) A. Find the equation of the aggregate demand curve. B. What is the equation of the long-run aggregate supply curve? C. What is the equilibrium price level when the unemployment rate is at NAIRU?PLEASE ANSWER ALL MULTIPLE CHOICE QUESTIONS (1-4) 1. Which of the following is FALSE in regards to an overnight target rate of 3.25%? a) The Bank of Canada will pay 3% interest on Chartered Banks' deposits with the Bank of Canada. b) The Bank of Canada will charge 3.5% on loans taken by the Chartered Banks from the Bank of Canada. c) The unemployment rate MUST be equal to the overnight target rate. Hence the unemployment rate is ALSO EQUAL to 3.5%. d) The overnight target rate is the interest rate that Chartered Banks will use when borrowing and lending money to each other. e) There are NO FALSE statements. All solutions provided are correct. 2. If there is an expected increase in Canada's overnight rate, what should we expect to occur? a) The Canadian dollar will be more valuable relative to other currencies. The Canadian dollar sees an increase in demand by foreigners seeking Canadian bonds and interest bearing investments. b) Canadian exports will rise. c) The stock market will…Consider a scenario of a closed economy in the short run where price level is fixed. Assume that both taxes and money supply increase in a way that keep output constant in equilibrium (suppose that the marginal propensity to consume is less than one). Which of the following may result from the policy change? a) It will lead to an increase in investment but a decrease in consumption.b) It will result in an increase in investment but a decrease in government spending.c) It will lead to an increase in investment and private saving.d) It will decrease investment but increase in public saving.
- The horizontal axis is labeled real output. Points Q 1, Q subscript f, and Q 2 are marked on the horizontal axis from left to right. The vertical axis is labeled price level. Points P 1, P 2, and P 3 are marked on the vertical axis from bottom to top. A rising line labeled A S 1 begins at the bottom left, passes through e (Q subscript f, P 1) and g (Q 2, P 2), and ends at the top-right. Another rising line labeled A S 2 begins at a point that is above the starting point of A S 1 passes through a (Q 1, P 1), b (Q subscript f, P 2), c (Q 2, P 3), and ends at a point that is above the ending point of A S 1. Another rising line labeled A S 3 begins at a point that is above the starting point of A S 2 passes through f (Q 1, P 2), d (Q subscript f, P 3), and ends at a point that is above the ending point of A S 2. Refer to the diagram. Assume that nominal wages initially are set based on the price level P2 and that the economy initially is operating at its full-employment level of output…Assume the U.S. is a closed economy and that it is starting out in both SR and LR equilibrium. Assume that not all prices are sticky. The Fed has been raising interest rates the last few months and will likely continue to do so. One result of this is that home loan (mortgage) rates have shot up from < 3% to over 7%, sending house prices across the U.S. lower (on average). Banks are also seeing loan default rates increase (not just for home loans, but for all loans) and are being more cautious about the loans they make and are increasing the amount of money they set aside to handle the expected loan defaults. A. Using appropriate graph(s), show and explain the short-run impact(s) of the events described above on the U.S. economy. B. Using just an AD/AS graph (and starting from your result in A), show and explain what happens in the long run. Put your new graph and explanation belowConsider a macroeconomic model for an open economy with the government. Consumption is given by C = 250 + bYd, where b = 0.8, Yd = (1-t)Y, and t = 0.1. Investment is given by I = 1,200 – 2,000R, and net export is given by X = 525 – 0.1Y – 500R. Assume that G = 1,200. Money demand is given by (Md/P) = 0.1283Y – 1,000R. Assume that P = 1, and the fixed money supply is given by (Ms/P) = 900. Drive the expression for the IS curve from the model. Drive the expression for the LM curve from the model. Drive the IS-LM equilibrium from the model.
- Assume that the housing market is in equilibrium in year 1. In year 2, the mortgage rate that banks charge consumers decreases, but producers are not affected. Also in year 2, the cost of lumber used to build homes decreases. Which of the following is most likely to be the equilibrium change? a The equilibrium will be at point C before the change in expectations and point B after the change b The equilibrium will be at point A before the change in expectations and point B after the change c The equilibrium will be at point A before the change in expectations and point E after the change d The equilibrium will be at point E before the change in expectations and point A after the changeAssume the following model of the closed economy in the short run, with the price level (P) fixed at 1.0: C=0.5(Y-T) T=1000 I=1500-250r G=1500 Md/p=0.5Y-500r Ms=1000 a) Derive a numerical formula for the IS curve, showing Y as a function of r alone. B)Derive a numerical formula for the LM curve, showing Y as a function of r alone. C) What are the short-run equilibrium values of Y, r, and national saving (S)?d)Assume that G increases by 1,500 (i.e., G = 3; 000). By how much will Y increase in short-run equilibrium? e)You are the chief economic adviser in this hypothetical economy. Do you believe that fiscal policy is more potent than monetary policy? Briefly discuss f)Derive the numerical aggregate demand (AD) curve for this economy, expressing Y as a function of PA principle difference between the new Classical and the new Keynesian models has to do with the choices made by business firms. We find that: a)new classical business firms choose the output level given the price level, while new Keynesian firms choose the price level given the level of output. b)new classical business firms choose the price level given the output level, while new Keynesian firms choose the output level given the level of output. c)both new classical and new Keynesian firms select the price level, but only new classical firms select the output level. d)both new classical and new Keynesian firms select the output level, but only Keynesian firms select the price level.
- For each of the following scenarios, assume the economy experiences an exogenous decrease in investment demand. For each case, illustrate the IS-LM-FX diagram and state the effect of the shock (increase, decrease, no change, or ambiguous) on the following variables: Y, i, E, C, I, TB. Here, we assume the policy makers’ objective is to keep output fixed at its initial valueP (a) AS(P 100) Q P $560 500 440 (b) AS(P125) Q P $500 440 380 (C) AS(P75) 125 125 125 $620 100 100 100 560 75 75 75 500 Suppose the full employment level of real output (Q) for a hypothetical economy is $500, the price level (P) initially is 100, and prices and wages are flexible both upward and downward. Refer to the accompanying short-run aggregate supply schedules. In the long run, an increase in the price level from 100 to 125 will O increase real output from $500 to $560. Q O change the aggregate supply schedule from (a) to (c) and result in an equilibrium level of real output of $560. O decrease real output from $500 to $440. O change the aggregate supply schedule from (a) to (b) and result in an equilibrium level of real output of $500 downkard. Refer to the accompanying short run aggegate supply schedules. in the long run. an increace in the price level from Show Transcribed TextIn a small closed economy, its aggregate demand and output are given as the equations below, Y = C + I + G; national output or GDP. C = 100 + 0.5(Y-T); consumption, marginal propensity to consume MPC = 0.5. I = 150 – 10*r; investment is a negative function of real interest rate (r as %). (M/P)d = Y – 20*r; real money demand which is adjusted by price level (inflation). G = 200; as government spending. T = 200; as tax. M = 2,400; as money supply. P = 4; the price level. (1) With the equations above, try to derive the IS curve. Tip: recall IS curve represent the relation between national output (Y) and real interest rate (r) in goods market. To derive IS curve, you need to put all components of Y together and find its connection with r. (2) Use the same equations, now try to derive the LM curve. Tip: recall LM curve represent the relation between national output (Y) and real interest rate (r) in money market. So to derive LM curve, you need to consider money supply and demand.…

