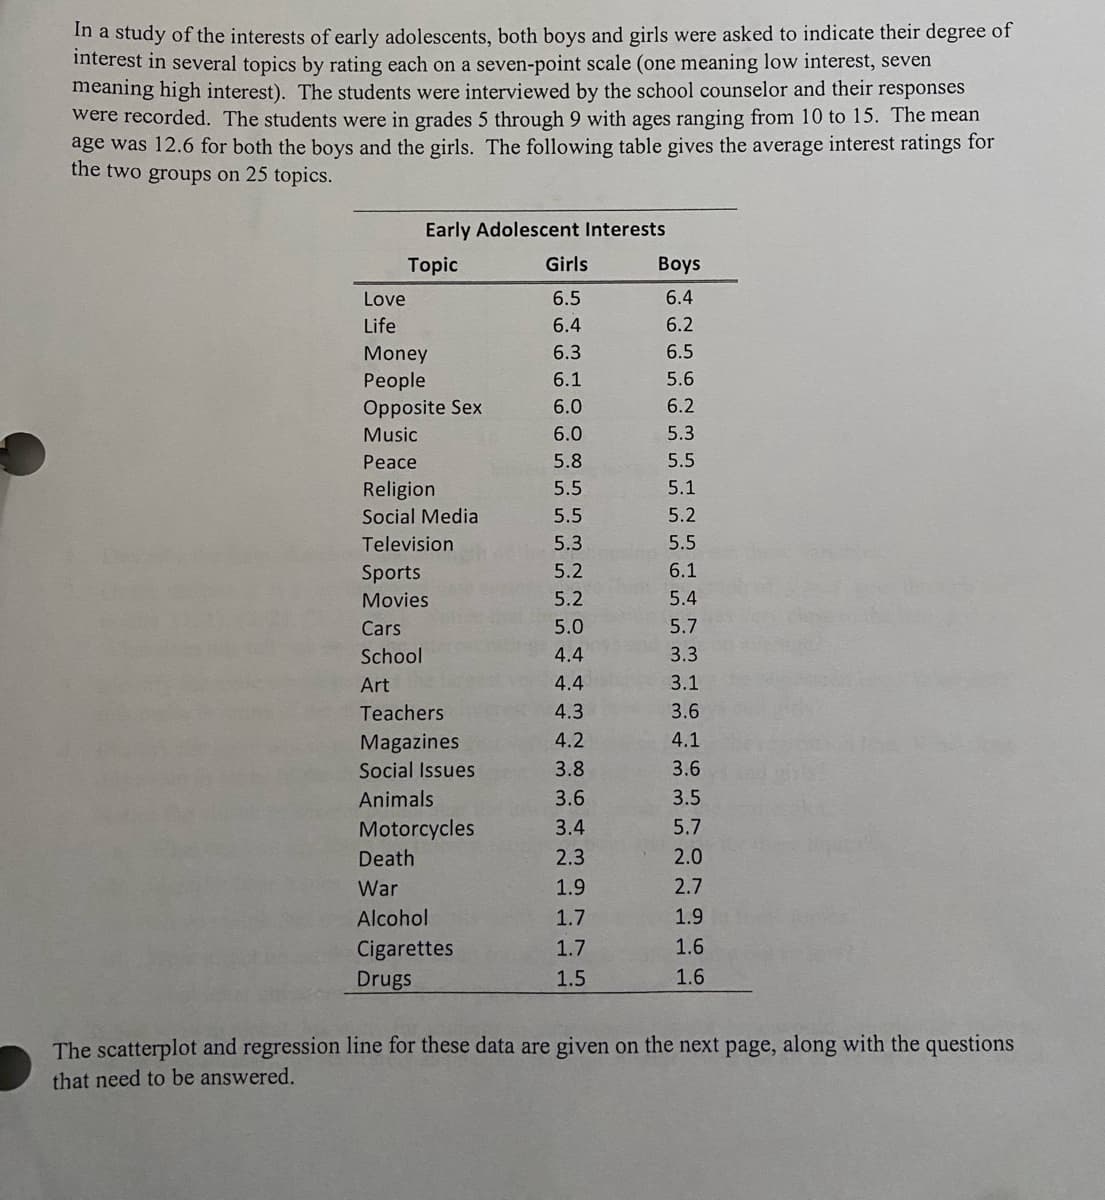
In a study of the interests of early adolescents, both boys and girls were asked to indicate their degree of interest in several topics by rating each on a seven-point scale (one meaning low interest, seven meaning high interest). The students were interviewed by the school counselor and their responses were recorded. The students were in grades 5 through 9 with ages ranging from 10 to 15. The mean age was 12.6 for both the boys and the girls. The following table gives the average interest ratings for the two groups on 25 topics.
In a study of the interests of early adolescents, both boys and girls were asked to indicate their degree of interest in several topics by rating each on a seven-point scale (one meaning low interest, seven meaning high interest). The students were interviewed by the school counselor and their responses were recorded. The students were in grades 5 through 9 with ages ranging from 10 to 15. The mean age was 12.6 for both the boys and the girls. The following table gives the average interest ratings for the two groups on 25 topics.

Glencoe Algebra 1, Student Edition, 9780079039897, 0079039898, 2018
18th Edition
ISBN:9780079039897
Author:Carter
Publisher:Carter
Chapter10: Statistics
Section10.4: Distributions Of Data
Problem 19PFA

Related questions
Question
Transcribed Image Text:In a study of the interests of early adolescents, both boys and girls were asked to indicate their degree of
interest in several topics by rating each on a seven-point scale (one meaning low interest, seven
meaning high interest). The students were interviewed by the school counselor and their responses
were recorded. The students were in grades 5 through 9 with ages ranging from 10 to 15. The mean
age was 12.6 for both the boys and the girls. The following table gives the average interest ratings for
the two groups on 25 topics.
Love
Life
Early Adolescent Interests
Topic
Money
People
Opposite Sex
Music
Peace
Religion
Social Media
Television.
Sports
Movies
Cars
School
Art
Teachers
Magazines
Social Issues
Animals
Motorcycles
Death
War
Alcohol
Cigarettes
Drugs
Girls
6.5
6.4
6.3
6.1
6.0
6.0
5.8
5.5
5.5
5.3
5.2
5.2
5.0
4.4
4.4
4.3
4.2
3.8
3.6
3.4
2.3
1.9
1.7
1.7
1.5
Boys
6.4
6.2
ܩ ܩ ܩ ܩ
6.5
5.6
6.2
5.3
5.5
5.1
5.2
5.5
6.1
5.4
5.7
3.3
3.1
3.6
4.1
3.6
3.5
5.7
565
PNNышш
679
2.0
2.7
1.9
1.6
1.6
The scatterplot and regression line for these data are given on the next page, along with the questions
that need to be answered.
![Interst Rating for Boys
7.0
6.0
5.0
4.0
3.0
2.0
1.0
1.0
2.0
Early Adolescent Interests
3.0
4.0
Interest Rating for Girls
5.0
6.0
7.0
1. Describe the form, direction, and strength of the relationship between these variables.
2.
Graph the line y = x on the coordinate system above [hint: the graph of y = x goes through the
points (1, 1), (2, 2), (3, 3), etc.]. Notice that the regression line lies very close to the line y = x.
What does this tell you about the interest ratings of boys and girls on average?
3. Identify the topic whose point is the largest vertical distance above the regression line. What does
this mean in terms of the difference in interest ratings between boys and girls?
4. Identify the topic whose point is the largest vertical distance below the regression line. What does
this mean in terms of the difference in interest ratings between boys and girls?
5. Notice the cluster of several points near the lower left corner of the scatterplot.
a.
What can you say about the interest ratings of boys and girls for these topics?
b. Identify those topics.
c. Do you think that early adolescents really are not interested in these topics?
d. What might be another explanation for why these ratings came out so low?
e. What other questions might this raise about the results?
6. If you were to repeat this study for students in your school district, how would you plan the study so
that you could learn, as accurately as possible the true interest levels for all of the topics being asked
about?](/v2/_next/image?url=https%3A%2F%2Fcontent.bartleby.com%2Fqna-images%2Fquestion%2Fd7e38a16-ab38-466f-8425-a06e3c07d6d2%2Fe77bd204-ad9d-4c0e-815b-5f4c11a53caf%2Fg1b6wjvv_processed.jpeg&w=3840&q=75)
Transcribed Image Text:Interst Rating for Boys
7.0
6.0
5.0
4.0
3.0
2.0
1.0
1.0
2.0
Early Adolescent Interests
3.0
4.0
Interest Rating for Girls
5.0
6.0
7.0
1. Describe the form, direction, and strength of the relationship between these variables.
2.
Graph the line y = x on the coordinate system above [hint: the graph of y = x goes through the
points (1, 1), (2, 2), (3, 3), etc.]. Notice that the regression line lies very close to the line y = x.
What does this tell you about the interest ratings of boys and girls on average?
3. Identify the topic whose point is the largest vertical distance above the regression line. What does
this mean in terms of the difference in interest ratings between boys and girls?
4. Identify the topic whose point is the largest vertical distance below the regression line. What does
this mean in terms of the difference in interest ratings between boys and girls?
5. Notice the cluster of several points near the lower left corner of the scatterplot.
a.
What can you say about the interest ratings of boys and girls for these topics?
b. Identify those topics.
c. Do you think that early adolescents really are not interested in these topics?
d. What might be another explanation for why these ratings came out so low?
e. What other questions might this raise about the results?
6. If you were to repeat this study for students in your school district, how would you plan the study so
that you could learn, as accurately as possible the true interest levels for all of the topics being asked
about?
Expert Solution
This question has been solved!
Explore an expertly crafted, step-by-step solution for a thorough understanding of key concepts.

This is a popular solution!
Step 1: Given information:
VIEWStep 2: Identify the form, direction and strength of the relationship between the variables:
VIEWStep 3: Graph the line y=x:
VIEWStep 4: Identify the topic whose point is the largest vertical distance above the regression line:
VIEWStep 5: Identify the topic whose point is the largest vertical distance below the regression line:
VIEWSolution
VIEW
Trending now
This is a popular solution!

Step by step
Solved in 6 steps with 3 images

Follow-up Questions
Read through expert solutions to related follow-up questions below.
Follow-up Question
E) what other questions might this raise about the results ?
Solution
Follow-up Question
If you were to repeat this study for students in your school district how would you plan the study so that you can learn, as accurately as possible the true interest levels for all of the topics being asked about?
Solution
Follow-up Question
What can you say about the interest ratings of boys and girls for these topics?
Solution
Follow-up Question
C) do you think that early adolescents really are interested in these topics?
Solution
Recommended textbooks for you
Glencoe Algebra 1, Student Edition, 9780079039897…
Algebra
ISBN:
9780079039897
Author:
Carter
Publisher:
McGraw Hill
Glencoe Algebra 1, Student Edition, 9780079039897…
Algebra
ISBN:
9780079039897
Author:
Carter
Publisher:
McGraw Hill