(ii) Largest sample variance (to one decimal place): Smallest sample variance (to one decimal place): Ratio of largest to smallest (to one decimal place): The ratio of the largest to the smallest sample variance is less-than-or-equal-to-four so it is safe to assume that the population variances are approx equal.
(ii) Largest sample variance (to one decimal place): Smallest sample variance (to one decimal place): Ratio of largest to smallest (to one decimal place): The ratio of the largest to the smallest sample variance is less-than-or-equal-to-four so it is safe to assume that the population variances are approx equal.

Glencoe Algebra 1, Student Edition, 9780079039897, 0079039898, 2018
18th Edition
ISBN:9780079039897
Author:Carter
Publisher:Carter
Chapter10: Statistics
Section10.3: Measures Of Spread
Problem 8PPS

Related questions

Question
100%
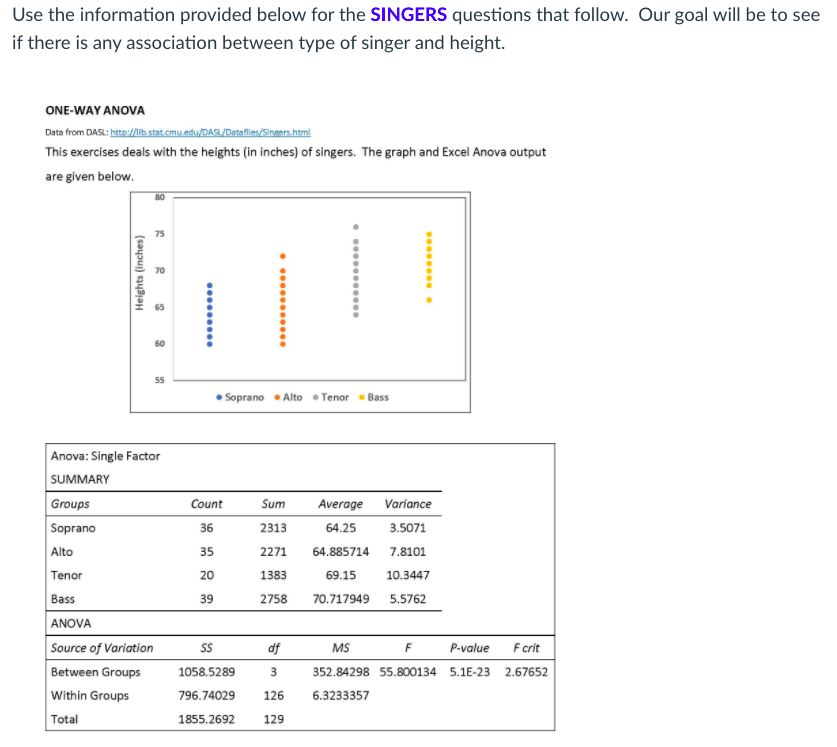
Transcribed Image Text:Use the information provided below for the SINGERS questions that follow. Our goal will be to see
if there is any association between type of singer and height.
ONE-WAY ANOVA
Data from DASL: http://ib.stat.cmu edu/DASL/Datafiles/Singers.html
This exercises deals with the heights (in inches) of singers. The graph and Excel Anova output
are given below.
80
55
Soprano • Alto • Tenor • Bass
Anova: Single Factor
SUMMARY
Groups
Count
Sum
Average
Variance
Soprano
36
2313
64.25
3.5071
Alto
35
2271
64.885714 7.8101
Tenor
20
1383
69.15
10.3447
Bass
39
2758
70.717949
5.5762
ANOVA
Source of Variation
df
MS
F crit
F
P-value
Between Groups
1058.5289
3
352.84298 55.800134 5.1E-23 2.67652
Within Groups
796.74029
126
6.3233357
Total
1855.2692
129
Heights (inches)
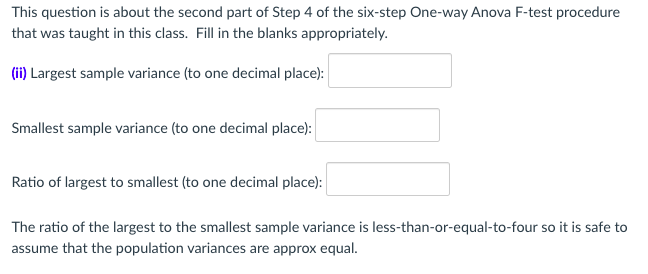
Transcribed Image Text:This question is about the second part of Step 4 of the six-step One-way Anova F-test procedure
that was taught in this class. Fill in the blanks appropriately.
(ii) Largest sample variance (to one decimal place):
Smallest sample variance (to one decimal place):
Ratio of largest to smallest (to one decimal place):
The ratio of the largest to the smallest sample variance is less-than-or-equal-to-four so it is safe to
assume that the population variances are approx equal.
Expert Solution
This question has been solved!
Explore an expertly crafted, step-by-step solution for a thorough understanding of key concepts.

This is a popular solution!

Trending now
This is a popular solution!

Step by step
Solved in 2 steps

Knowledge Booster


Learn more about
Need a deep-dive on the concept behind this application? Look no further. Learn more about this topic, statistics and related others by exploring similar questions and additional content below.Recommended textbooks for you
Glencoe Algebra 1, Student Edition, 9780079039897…
Algebra
ISBN:
9780079039897
Author:
Carter
Publisher:
McGraw Hill

Holt Mcdougal Larson Pre-algebra: Student Edition…
Algebra
ISBN:
9780547587776
Author:
HOLT MCDOUGAL
Publisher:
HOLT MCDOUGAL
Glencoe Algebra 1, Student Edition, 9780079039897…
Algebra
ISBN:
9780079039897
Author:
Carter
Publisher:
McGraw Hill
Holt Mcdougal Larson Pre-algebra: Student Edition…
Algebra
ISBN:
9780547587776
Author:
HOLT MCDOUGAL
Publisher:
HOLT MCDOUGAL