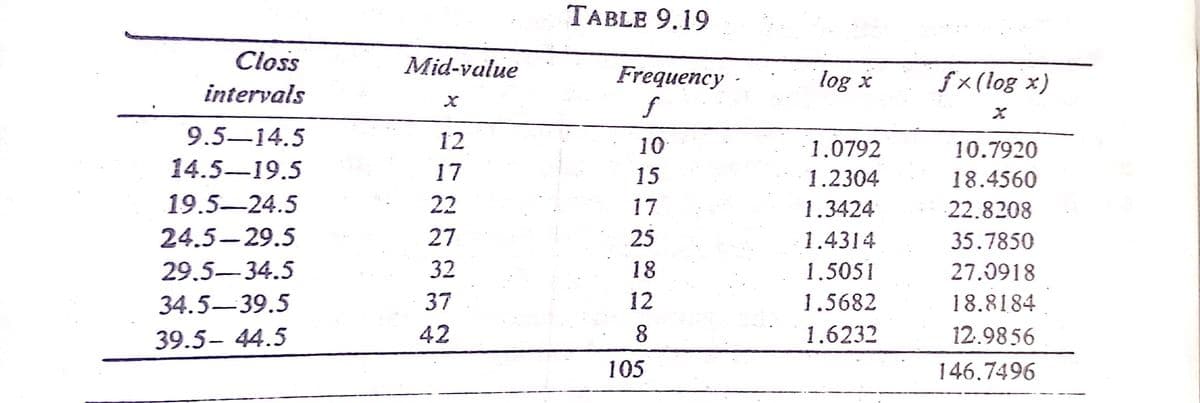
Illustration 9.22. Calculate the GM of the data given in the first two columns Table 9.19.


Q: uch data seis do you think are more likely to be normally distributed For each of the following pair...
A: Normal distribution is used for calculating the probability of a continuous variable when the data i...
Q: 9 9.13. Admissions during 1971 to 'Vidya Mandir,' and "Children's Home' increased by 20% and 40% res...
A:
Q: Baby weights: The weight of male babies less than 2 months old in the United States is normally dist...
A:
Q: Using the data below make a frequency distribution table containing the following: 1. classes with ...
A: Frequency distribution table : A distribution table is one approach to organize knowledge to form it...
Q: A process that manufactures glass sheets is supposed to be calibrated so that the mean thickness μ o...
A: Given α=0.05,n=100,σ=0.23 Find a) If 100 sheets are sampled, what is the power of a test made at the...
Q: I collected two samples of data, and found that the assumption of homogeneity of variance was violat...
A: Given information: s1=10, n1=35s2=45, n2=35
Q: ustration 9.3. Calculate the mean of the marks of 46 students given in Table 9.1. TABLE 9.1. FREQUEN...
A: Calculate mean of marks of 46 students
Q: Refers to the population which consists of the objects or entities under consideration in the survey...
A: The correct option is (B) Statistical Population. Because, The sampled population is the population ...
Q: Listed below are the numbers of years that archbishops and monarchs in a certain country lived after...
A:
Q: Illustration 8.7. Present the data of Table 8.8 by a suitable histo- gram. TABLE 8.8. AVERAGE MONTHL...
A:
Q: (a) The figure to the right represents the normal curve with u=266 days and o = 16 days. The area to...
A: Let X denote the length of human pregnancies. Given that X follows N(mean = 266, SD = 16)
Q: Exercise 1: Solving for X In 2021, the average SAT score for students in the freshman class of Nunya...
A: To find the x value using z- score, the formula is defined as shown below ...
Q: (a) The length Discrete Continuous (b) The time taken to repair each car Discrete Continuous (c) The...
A:
Q: CetaceaNow is a conservationist organization that monitors the health of whale and dolphin populatio...
A: Given
Q: 11 Construct a proportional stratified sample for the following situation: We are surveying undergra...
A: The objective is to obtain the appropriate sample size for the given strata (or groups) of different...
Q: Question 1: The Gulf Trading Company plans to purchase an embroidery machine for their sewing unit. ...
A: The objective is to choose which machine is more consistent using variance test
Q: The times to pop a regular bag of microwave popcorn without burning it are Normally distributed with...
A: Given that The times to pop a regular bag of microwave popcorn without burning it are Normally dist...
Q: Assume the random variable X is normally distributed with mean p= 50 and standard deviation a=7. Fin...
A: Solution
Q: Compute the mean, variance, and standard error of the sampling distribution of the sample means give...
A:
Q: 2. The following list represents the percentage of oxygen content (in g/L) of a given substance afte...
A:
Q: Question 4 A standard nomal transformation has been performed on the random variable Y, using the fo...
A: Introduction: It is required to identify the contradiction in the graph and the equation of the z-sc...
Q: Small sample: Twenty concrete blocks were sampled and tested for crushing strength in order to estim...
A:
Q: A sürvey of students in a large introductory statistics class asked about Birth Order their birth or...
A:
Q: 2. Suppose the reaction temperature X (in°C) in a certain chemical process has a uniform distributio...
A: As per bartelby guideline expert have to answer first three subparts only dear student please upload...
Q: We would like to fit a linear regression estimate to the dataset D = {(x"), y), (x(), y(2),... , (xN...
A: Given that to fit linear regression estimate to dataset D=x1,y1, x2,y2,..., xN,yN with xi∈ℝM by mini...
Q: In how many ways can the letters of the word PROBABILITY be arranged? A. 19, 958,400 B. 9, 979, 200 ...
A: The objective is to identify the number of ways the defined word, i.e., PROBABILITY can be arranged.
Q: 8. The Muscat Distributing Company is investigating two different scheduling methods for its truck d...
A: For the given data find ( a ) mean =? s.d =? for both methods ( b ) C.V =? for both methods
Q: Listed below are the lead concentrations in µg/g measured in different traditional medicines. Use a ...
A:
Q: Give two values that have about 50% of the math scores between them: .................. and ...........
A: Here Given 64 students took a technical exam last week 28 took math test and 36 took physics test.
Q: You should be able to select the table and copy it directly to Excel or other such programs. 18.8 23...
A: i) Range = Maximum value -Minimum value Excel function to find maximum value is , "= MAX( select al...
Q: Exit polling is a popular technique used to determine the outcome of an election prior to results be...
A: Given that Sample size (n) = 200 People voted for referendum = 104 Sample proportion (p) = 104200 =...
Q: Which of the two curves exhibits exponential growth?
A: Here Given the two graph
Q: Suppose that the sitting back-to-knee length for a group of adults has a normal distribution with a ...
A:
Q: Mama Rosa equally divided 9 quarts of homemade tomato sauce into 5 jars for her family members. How ...
A: Given The data is as follows: 9 quarts of homemade tomato sauce was divided into 5 jars.
Q: Four out of every five trucks on the highway are followed by a car, while only one out of every four...
A: If a truck goes by the next vehicle will be a car with probability 4/5 and will be a truck with prob...
Q: A research center claims that at least 23% of adults in a certain country think that their taxes wil...
A:
Q: . In an independent samples t test, the mean of the sampling distribution of differences between our...
A:
Q: A cdinical trial was conducted to test the effectiveness of a drug for treating insomnia in older su...
A:
Q: uestion Consider an example of the prisoner's dilemma where 2 firms are making sealed bids on a high...
A: Given: The firm is allowed to bid either $110 or either $130 million
Q: Exercise #1 Construct Sampling Distributions from a known Probability Distributions Construct a samp...
A: Please find the solution below.
Q: (hint: sx = 3.1623, sy = 1.5811) Y 1 4 9 3 3 85 .68 -.68 -.85 2. 2.
A:
Q: Hề föund that 14 of those products For the festival promoter's sample, find and write with proper no...
A:
Q: Find the critical value tn needed to construct a confidence interval of the given level with the giv...
A: Given information- We have given the confidence level and sample size to calculate the critical valu...
Q: You should be able to select the table and copy it directly to Excel or other such programs. 18.8 23...
A: 18.8,23.8,29.1,32.6,38.9,40.7,47.2,52.5,28,47.4,44.4,34.4,33,34,29.9,53.6,35.4,50,29.6,27.4,29.6,29....
Q: Find the critical value(s) and rejection region(s) for the indicated t-test, level of significance a...
A: Using the given information of significance level (i.e., denoted with α=0.10) and sample size (i.e.,...
Q: Cuts Pizza is a large restaurant chain. After paying for a meal at Cuts Pizza, customers are asked t...
A:
Q: Illustration 9.4. The first and third columns of Table 9.3 give the frequency distribution of the av...
A:
Q: Aused car dealer says that the mean price of a three-year-old sports utility vehicle is $23,000. You...
A: Given: Hypothesis population mean = µ = 23000 Sample Mean (x ) = 23626 Sample Sta...
Q: Check our blood pressure: In a recent study, the Centers for Disease Control and prevention reported...
A: Given data,Mean μ=80.3sd σ=9.7P(X<68)=?
Q: Estimate the variance of the number of FHH members. Upload a snapshot of your solution. Estimate th...
A: For FHH size, Mean=Average of the valuesNumber of values =3+4+5+5+6+5+6+3+6+7+4+5+3+6+515 ...


Step by step
Solved in 2 steps with 2 images

- b) Explain how X can be related to the exponential distribution by using a moment generating function argument.Suppose that the length of a phone call in minutes follows exponential distribution with parameter λ=8. If some one comes ahead of you in queue of telephone booth, then find the probability that you have to wait between 10 and 20 minutes.Suppose that the length of long distance phone calls, mea- sured in minutes, is known to have an exponential distribution with the average length of a call equal to 15 minutes. Find the CDF.
- Suppose that the length of long distance phone calls, measured in minutes, is known to have an exponential distribution with the average length of a call equal to $18 minutes. The lambda of this distribution is The probability that the length of a phone call is longer than 22 is P(x ≥ 22) = The probability that the length of a phone call is shorter than 12 is P(x ≤ 12) =Suppose that Steph Curry's cumulative free throw percentage, one month into the NBA season, is below 80%, but that one game later it is above 80%. Did there have to be a moment where his cumulative free throw percentage was exactly 80%? If no, give a simple numerical example showing how this might fail to happen. If yes, explain why there must have been such a moment.Suppose that the first Section of Applied Stat class ends at 13:20 and the second starts at 13:30 with ten minutes break. Professor, who teaches both sections, wants to go to bathroom during the break. Suppose that the time that takes for professor to go to bathroom and come back to the classroom has an exponential distribution with the mean of 6.7 minutes. Find the probability that the professor will be late for class for less than 3 minutes (round to 3 decimal places).
- A random sample of size n = 225 is to be taken from an exponential population with θ = 4. Based on the cen-tral limit theorem, what is the probability that the mean of the sample will exceed 4.5?show geometric distributions belong to exponential classSuppose the time until your iPhone breaks is uniformly distributed between 0 and 8 years. You will get a new phone as soon as your iPhone breaks or at time 2 (when a new iPhone is released), whichever is first. Find the standard deviation for the time until you get a new phone.1. 0.622. 0.553. 0.494. 0.525. 0.57
- Suppose that during rainy season on a tropical island the length of theshower has an exponential distribution, with parameter λ = 2, time beingmeasured in minutes. What is the probability that a shower will last morethan three minutes? If a shower has already lasted for 2 minutes, what is theprobability that it will last for at least one more minute?suppose that the mean time for a certain car to go from 0 to 60 miles per hour was 8.6 seconds. Suppose that you want to test the claim that the average time to accelerate from 0 to 60 miles per hour is longer than 8.6 secons. What would you use for the alternative hypothesis?A microprocessor that controls the tuner in color TVs fails completely at random (that is, according to the exponential distribution). Suppose that the likelihood that a microprocessor that has survived for k years fails in year k + 1 is .0036. What is the cumulative distribution function of the time until failure of the microprocessor?