Imagine the following case study where two different countries: Albania and Belize have remained self-sufficient and mostly produce two of the following products: corn and beets. Our hopes are that we will be able to improve trade liberalization and encourage each one to work together in order to improve the number of resources and goods each one provides to their population. Here are their production levels for each product per worker/month (assume each country has a workforce for 15 workers): Bushels Corn (Y-аxis) Вeets (X-аxis) Albania 40 20 Belize 20 4 a) Calculate and graph the Production possibilities frontiers for both countries. b) Assume that both countries currently prefer equal amounts of corn and beet for their production & consumption levels within their country, clearly label this point and call it point B: production/consumption before trade. c) Calculate and state the number of workers that would be required in order to produce points B for both countries. d) Complete the table below showing the different levels of opportunity cost
Imagine the following case study where two different countries: Albania and Belize have remained self-sufficient and mostly produce two of the following products: corn and beets. Our hopes are that we will be able to improve trade liberalization and encourage each one to work together in order to improve the number of resources and goods each one provides to their population. Here are their production levels for each product per worker/month (assume each country has a workforce for 15 workers): Bushels Corn (Y-аxis) Вeets (X-аxis) Albania 40 20 Belize 20 4 a) Calculate and graph the Production possibilities frontiers for both countries. b) Assume that both countries currently prefer equal amounts of corn and beet for their production & consumption levels within their country, clearly label this point and call it point B: production/consumption before trade. c) Calculate and state the number of workers that would be required in order to produce points B for both countries. d) Complete the table below showing the different levels of opportunity cost

Chapter18: International Trade And Comparative Advantage
Section: Chapter Questions
Problem 2TY

Related questions
Question
100%
Can question B be further explained? There is already an answer on Bartleby but I am unsure how the expert arrived at that answer.
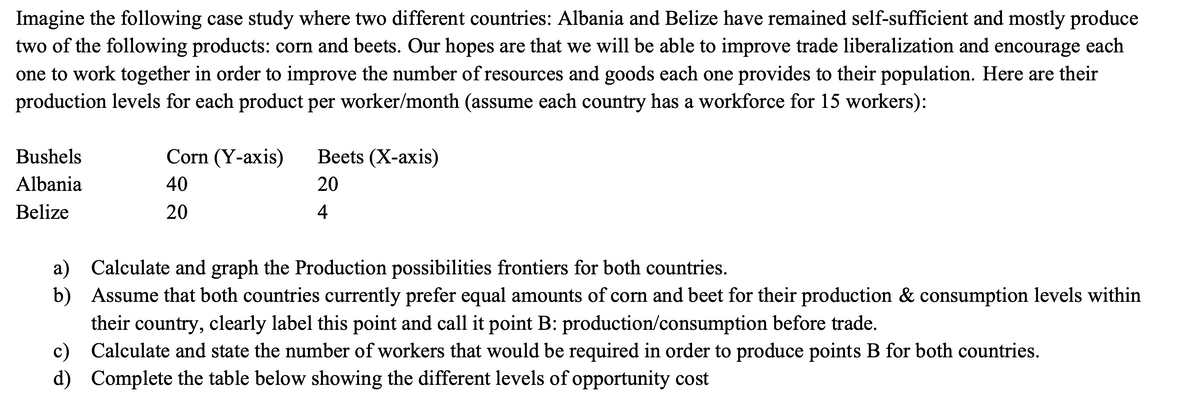
Transcribed Image Text:Imagine the following case study where two different countries: Albania and Belize have remained self-sufficient and mostly produce
two of the following products: corn and beets. Our hopes are that we will be able to improve trade liberalization and encourage each
one to work together in order to improve the number of resources and goods each one provides to their population. Here are their
production levels for each product per worker/month (assume each country has a workforce for 15 workers):
Bushels
Corn (Y-axis)
Вets (X-аxis)
Albania
40
20
Belize
20
4
a) Calculate and graph the Production possibilities frontiers for both countries.
b) Assume that both countries currently prefer equal amounts of corn and beet for their production & consumption levels within
their country, clearly label this point and call it point B: production/consumption before trade.
c) Calculate and state the number of workers that would be required in order to produce points B for both countries.
d) Complete the table below showing the different levels of opportunity cost
Expert Solution
This question has been solved!
Explore an expertly crafted, step-by-step solution for a thorough understanding of key concepts.

This is a popular solution!

Trending now
This is a popular solution!

Step by step
Solved in 4 steps with 3 images

Knowledge Booster


Learn more about
Need a deep-dive on the concept behind this application? Look no further. Learn more about this topic, economics and related others by exploring similar questions and additional content below.Recommended textbooks for you

Principles of Macroeconomics (MindTap Course List)
Economics
ISBN:
9781285165912
Author:
N. Gregory Mankiw
Publisher:
Cengage Learning

Essentials of Economics (MindTap Course List)
Economics
ISBN:
9781337091992
Author:
N. Gregory Mankiw
Publisher:
Cengage Learning
Principles of Macroeconomics (MindTap Course List)
Economics
ISBN:
9781285165912
Author:
N. Gregory Mankiw
Publisher:
Cengage Learning
Essentials of Economics (MindTap Course List)
Economics
ISBN:
9781337091992
Author:
N. Gregory Mankiw
Publisher:
Cengage Learning

Principles of Economics (MindTap Course List)
Economics
ISBN:
9781305585126
Author:
N. Gregory Mankiw
Publisher:
Cengage Learning

Principles of Microeconomics (MindTap Course List)
Economics
ISBN:
9781305971493
Author:
N. Gregory Mankiw
Publisher:
Cengage Learning

Principles of Economics, 7th Edition (MindTap Cou…
Economics
ISBN:
9781285165875
Author:
N. Gregory Mankiw
Publisher:
Cengage Learning