In 1888, a survey was taken of Swiss provinces in an attempt to measure the relationships betweeen several different variables. One relationship of interest is the relationship between the education rate of a province and the province's infant mortality. A sample of 21 different provinces was taken. In each province, the percent of individuals in the province who had education beyond primary school was measured ("Education") as well as the provinces' infant mortality rate (live births that lived less than one year, "Infant"). This data is shown in the two vectors below. To use the data, copy and paste the following lines into your R or RStudio console. Infant=c(19.8,18,23.6,18,19.1,23.6,15.1,22.2,23.6,10.8,24.9,19.5,21,15.3,22.7,21,22.4,24.9,20,10.8,22.2) Education=c(6,53,7,10,7,7,2,9,7,20,8,7,1,6,12,7,3,8,8,20,9) a. Compute the correlation between the percent of individuals who had education beyond primary school and infant mortality rate. Answer: Round to at least five decimals if necessary b. State the regression equation used to express the infant mortality rate (Y) as a linear function of the percent of individuals who had education beyond primary school (X). Report all decimals printed by R. Yi = ? く Xi c. Which of the following is the best interpretation of B₁ in the above regression equation? A. As the percent of individuals who had education beyond primary school increases by 1%, infant mortality decreases by B₁ units B. The percent of individuals who had education beyond primary school for a province with an infant mortality rate of 0 units is, on average, 61% C. As the percent of individuals who had education beyond primary school increases by 81%, infant mortality rate decreases on average by 1 unit D. As the percent of individuals who had education beyond primary school increases by 1%, infant mortality increases on average by B₁ units E. The infant mortality for a province with 0% percent of individuals who had education beyond primary school is, on average, ẞ1 F. As the percent of individuals who had education beyond primary school increases by ẞ1%, infant mortality rate decreases by 1 unit d. The coefficient of determination tells us that % of the variation in ? with ? ✓ Round to at least five decimals if necessary is explained by its linear relationship e. Consider the tenth province in the dataset, which is a province that has a percent of individuals who had education beyond primary school of 20% and an infant mortality of 10.8 units. Compute the residual for this province.
In 1888, a survey was taken of Swiss provinces in an attempt to measure the relationships betweeen several different variables. One relationship of interest is the relationship between the education rate of a province and the province's infant mortality. A sample of 21 different provinces was taken. In each province, the percent of individuals in the province who had education beyond primary school was measured ("Education") as well as the provinces' infant mortality rate (live births that lived less than one year, "Infant"). This data is shown in the two vectors below. To use the data, copy and paste the following lines into your R or RStudio console. Infant=c(19.8,18,23.6,18,19.1,23.6,15.1,22.2,23.6,10.8,24.9,19.5,21,15.3,22.7,21,22.4,24.9,20,10.8,22.2) Education=c(6,53,7,10,7,7,2,9,7,20,8,7,1,6,12,7,3,8,8,20,9) a. Compute the correlation between the percent of individuals who had education beyond primary school and infant mortality rate. Answer: Round to at least five decimals if necessary b. State the regression equation used to express the infant mortality rate (Y) as a linear function of the percent of individuals who had education beyond primary school (X). Report all decimals printed by R. Yi = ? く Xi c. Which of the following is the best interpretation of B₁ in the above regression equation? A. As the percent of individuals who had education beyond primary school increases by 1%, infant mortality decreases by B₁ units B. The percent of individuals who had education beyond primary school for a province with an infant mortality rate of 0 units is, on average, 61% C. As the percent of individuals who had education beyond primary school increases by 81%, infant mortality rate decreases on average by 1 unit D. As the percent of individuals who had education beyond primary school increases by 1%, infant mortality increases on average by B₁ units E. The infant mortality for a province with 0% percent of individuals who had education beyond primary school is, on average, ẞ1 F. As the percent of individuals who had education beyond primary school increases by ẞ1%, infant mortality rate decreases by 1 unit d. The coefficient of determination tells us that % of the variation in ? with ? ✓ Round to at least five decimals if necessary is explained by its linear relationship e. Consider the tenth province in the dataset, which is a province that has a percent of individuals who had education beyond primary school of 20% and an infant mortality of 10.8 units. Compute the residual for this province.

Glencoe Algebra 1, Student Edition, 9780079039897, 0079039898, 2018
18th Edition
ISBN:9780079039897
Author:Carter
Publisher:Carter
Chapter10: Statistics
Section10.6: Summarizing Categorical Data
Problem 26PPS
Question
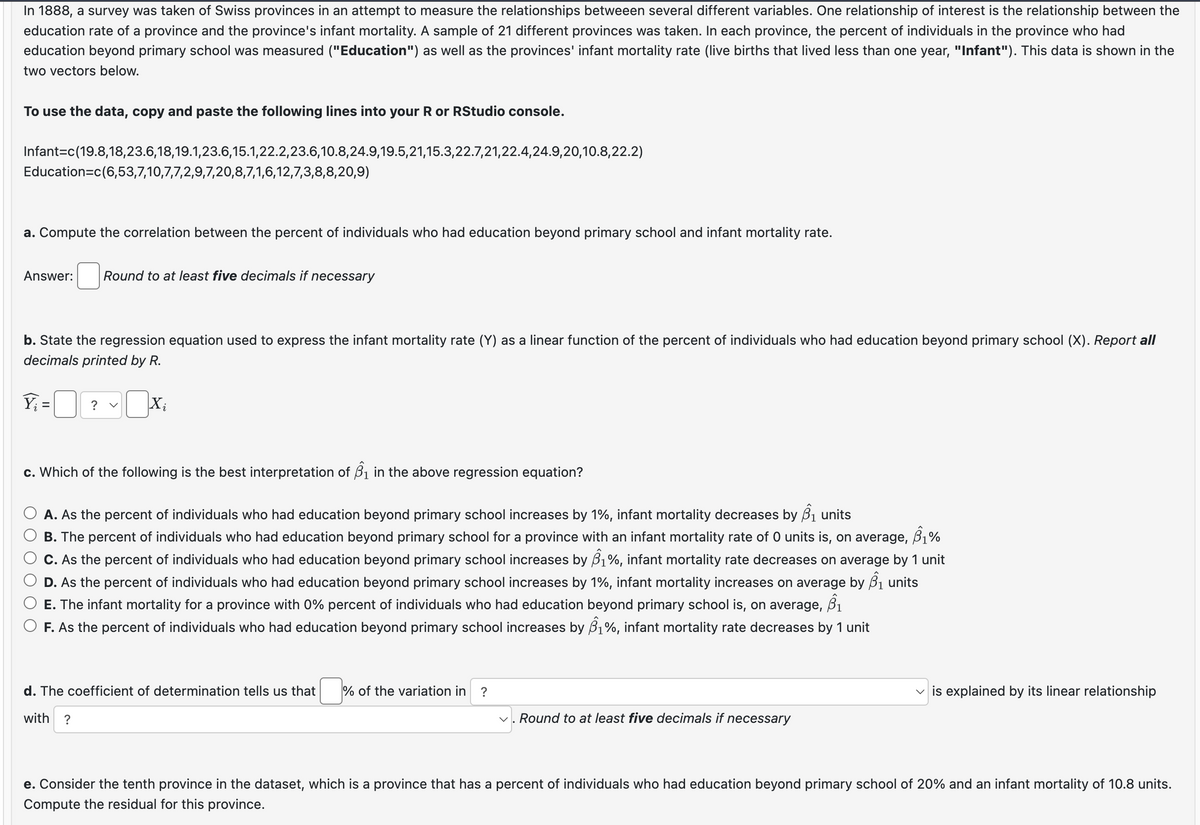
Transcribed Image Text:In 1888, a survey was taken of Swiss provinces in an attempt to measure the relationships betweeen several different variables. One relationship of interest is the relationship between the
education rate of a province and the province's infant mortality. A sample of 21 different provinces was taken. In each province, the percent of individuals in the province who had
education beyond primary school was measured ("Education") as well as the provinces' infant mortality rate (live births that lived less than one year, "Infant"). This data is shown in the
two vectors below.
To use the data, copy and paste the following lines into your R or RStudio console.
Infant=c(19.8,18,23.6,18,19.1,23.6,15.1,22.2,23.6,10.8,24.9,19.5,21,15.3,22.7,21,22.4,24.9,20,10.8,22.2)
Education=c(6,53,7,10,7,7,2,9,7,20,8,7,1,6,12,7,3,8,8,20,9)
a. Compute the correlation between the percent of individuals who had education beyond primary school and infant mortality rate.
Answer:
Round to at least five decimals if necessary
b. State the regression equation used to express the infant mortality rate (Y) as a linear function of the percent of individuals who had education beyond primary school (X). Report all
decimals printed by R.
Yi
=
? く
Xi
c. Which of the following is the best interpretation of B₁ in the above regression equation?
A. As the percent of individuals who had education beyond primary school increases by 1%, infant mortality decreases by B₁ units
B. The percent of individuals who had education beyond primary school for a province with an infant mortality rate of 0 units is, on average, 61%
C. As the percent of individuals who had education beyond primary school increases by 81%, infant mortality rate decreases on average by 1 unit
D. As the percent of individuals who had education beyond primary school increases by 1%, infant mortality increases on average by B₁ units
E. The infant mortality for a province with 0% percent of individuals who had education beyond primary school is, on average, ẞ1
F. As the percent of individuals who had education beyond primary school increases by ẞ1%, infant mortality rate decreases by 1 unit
d. The coefficient of determination tells us that % of the variation in
?
with
?
✓
Round to at least five decimals if necessary
is explained by its linear relationship
e. Consider the tenth province in the dataset, which is a province that has a percent of individuals who had education beyond primary school of 20% and an infant mortality of 10.8 units.
Compute the residual for this province.
Expert Solution
This question has been solved!
Explore an expertly crafted, step-by-step solution for a thorough understanding of key concepts.

Step by step
Solved in 2 steps with 4 images

Recommended textbooks for you
Glencoe Algebra 1, Student Edition, 9780079039897…
Algebra
ISBN:
9780079039897
Author:
Carter
Publisher:
McGraw Hill

Big Ideas Math A Bridge To Success Algebra 1: Stu…
Algebra
ISBN:
9781680331141
Author:
HOUGHTON MIFFLIN HARCOURT
Publisher:
Houghton Mifflin Harcourt
Glencoe Algebra 1, Student Edition, 9780079039897…
Algebra
ISBN:
9780079039897
Author:
Carter
Publisher:
McGraw Hill
Big Ideas Math A Bridge To Success Algebra 1: Stu…
Algebra
ISBN:
9781680331141
Author:
HOUGHTON MIFFLIN HARCOURT
Publisher:
Houghton Mifflin Harcourt