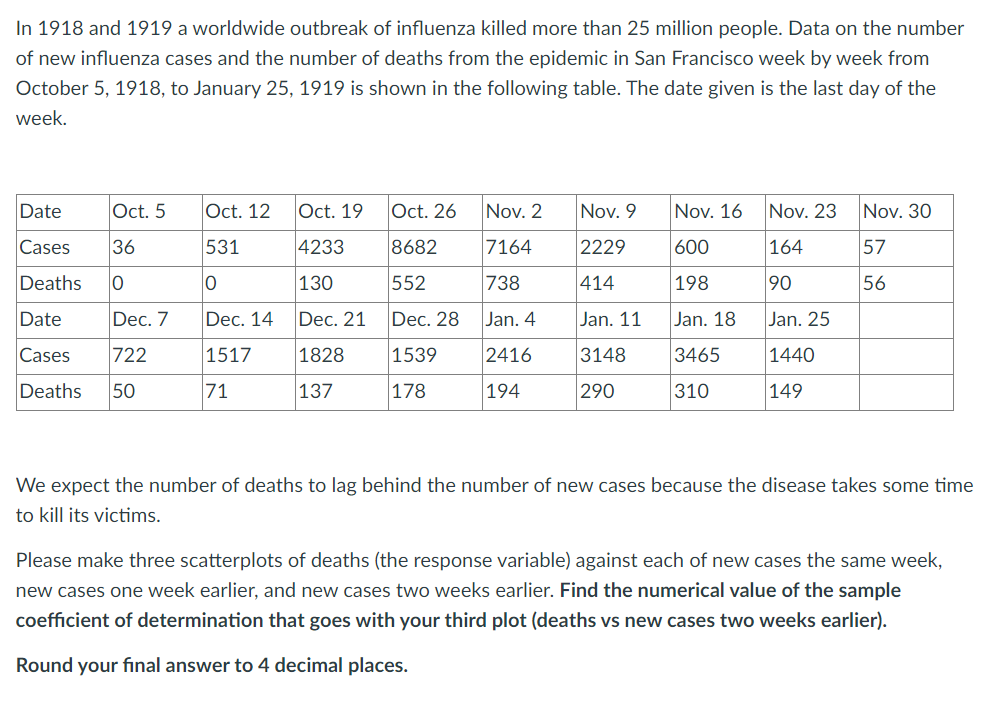
In 1918 and 1919 a worldwide outbreak of influenza killed more than 25 million people. Data on the number of new influenza cases and the number of deaths from the epidemic in San Francisco week by week from October 5, 1918, to January 25, 1919 is shown in the following table. The date given is the last day of the week. Date Cases Deaths Date Dec. 7 Cases 722 Deaths 50 Oct. 5 36 0 Oct. 12 Oct. 19 531 4233 10 130 Dec. 14 Dec. 21 1517 1828 71 137 Oct. 26 8682 552 Dec. 28 1539 178 Nov. 2 7164 738 Jan. 4 2416 194 Nov. 9 2229 414 Jan. 11 3148 290 Nov. 16 600 198 Jan. 18 3465 310 Nov. 23 164 90 Jan. 25 1440 149 Nov. 30 57 56 We expect the number of deaths to lag behind the number of new cases because the disease takes some time to kill its victims.
In 1918 and 1919 a worldwide outbreak of influenza killed more than 25 million people. Data on the number of new influenza cases and the number of deaths from the epidemic in San Francisco week by week from October 5, 1918, to January 25, 1919 is shown in the following table. The date given is the last day of the week. Date Cases Deaths Date Dec. 7 Cases 722 Deaths 50 Oct. 5 36 0 Oct. 12 Oct. 19 531 4233 10 130 Dec. 14 Dec. 21 1517 1828 71 137 Oct. 26 8682 552 Dec. 28 1539 178 Nov. 2 7164 738 Jan. 4 2416 194 Nov. 9 2229 414 Jan. 11 3148 290 Nov. 16 600 198 Jan. 18 3465 310 Nov. 23 164 90 Jan. 25 1440 149 Nov. 30 57 56 We expect the number of deaths to lag behind the number of new cases because the disease takes some time to kill its victims.

Linear Algebra: A Modern Introduction
4th Edition
ISBN:9781285463247
Author:David Poole
Publisher:David Poole
Chapter2: Systems Of Linear Equations
Section2.4: Applications
Problem 2EQ: 2. Suppose that in Example 2.27, 400 units of food A, 500 units of B, and 600 units of C are placed...

Related questions
Question
[STATISTICS] How do you solve this?
Transcribed Image Text:In 1918 and 1919 a worldwide outbreak of influenza killed more than 25 million people. Data on the number
of new influenza cases and the number of deaths from the epidemic in San Francisco week by week from
October 5, 1918, to January 25, 1919 is shown in the following table. The date given is the last day of the
week.
Oct. 5
Date
Cases 36
Deaths
0
Date
Dec. 7
Cases 722
Deaths 50
Oct. 12
531
10
Dec. 14
1517
71
Oct. 19
4233
130
Dec. 21
1828
137
Oct. 26
8682
552
Dec. 28
1539
178
Nov. 2
7164
738
Jan. 4
2416
194
Nov. 9
2229
414
Jan. 11
3148
290
Nov. 16
600
198
Jan. 18
3465
310
Nov. 23
164
90
Jan. 25
1440
149
Nov. 30
57
56
We expect the number of deaths to lag behind the number of new cases because the disease takes some time
to kill its victims.
Please make three scatterplots of deaths (the response variable) against each of new cases the same week,
new cases one week earlier, and new cases two weeks earlier. Find the numerical value of the sample
coefficient of determination that goes with your third plot (deaths vs new cases two weeks earlier).
Round your final answer to 4 decimal places.
Expert Solution
This question has been solved!
Explore an expertly crafted, step-by-step solution for a thorough understanding of key concepts.

Step by step
Solved in 4 steps with 16 images

Recommended textbooks for you
Linear Algebra: A Modern Introduction
Algebra
ISBN:
9781285463247
Author:
David Poole
Publisher:
Cengage Learning

Glencoe Algebra 1, Student Edition, 9780079039897…
Algebra
ISBN:
9780079039897
Author:
Carter
Publisher:
McGraw Hill

Algebra and Trigonometry (MindTap Course List)
Algebra
ISBN:
9781305071742
Author:
James Stewart, Lothar Redlin, Saleem Watson
Publisher:
Cengage Learning
Linear Algebra: A Modern Introduction
Algebra
ISBN:
9781285463247
Author:
David Poole
Publisher:
Cengage Learning
Glencoe Algebra 1, Student Edition, 9780079039897…
Algebra
ISBN:
9780079039897
Author:
Carter
Publisher:
McGraw Hill
Algebra and Trigonometry (MindTap Course List)
Algebra
ISBN:
9781305071742
Author:
James Stewart, Lothar Redlin, Saleem Watson
Publisher:
Cengage Learning