In 1980 and again in 2010, a Gallup poll asked a random sample of 1000 US citizens "Are you in favor of the death penalty for a person convicted of murder?" In 1980, the proportion saying yes was 0.66. In 2010, it was 0.64. Does this data provide evidence that the proportion of US citizens favoring the death penalty was higher in 1980 than it was in 2010? Use pi for the proportion in 1980 and p2 for the proportion in 2010. (1) State the null and alternative hypotheses: (2) What is the sample statistic? (3) A randomization distribution assuming the null hypothesis is true is shown. Which of the following is closest to the p-value? Randomization Dotplot of -2 Null Hypothesis: p1=p2 Left Tail Two-Tail Right Tail 70 60 50 40 30 20 10 -0.06 0.001, 0.05, 0.20, 0.5 -0.04 -0.02 null-0 0.02 0.04 comples-1000 mean--0.001 at dev -0.021 3 0.06
In 1980 and again in 2010, a Gallup poll asked a random sample of 1000 US citizens "Are you in favor of the death penalty for a person convicted of murder?" In 1980, the proportion saying yes was 0.66. In 2010, it was 0.64. Does this data provide evidence that the proportion of US citizens favoring the death penalty was higher in 1980 than it was in 2010? Use pi for the proportion in 1980 and p2 for the proportion in 2010. (1) State the null and alternative hypotheses: (2) What is the sample statistic? (3) A randomization distribution assuming the null hypothesis is true is shown. Which of the following is closest to the p-value? Randomization Dotplot of -2 Null Hypothesis: p1=p2 Left Tail Two-Tail Right Tail 70 60 50 40 30 20 10 -0.06 0.001, 0.05, 0.20, 0.5 -0.04 -0.02 null-0 0.02 0.04 comples-1000 mean--0.001 at dev -0.021 3 0.06

Holt Mcdougal Larson Pre-algebra: Student Edition 2012
1st Edition
ISBN:9780547587776
Author:HOLT MCDOUGAL
Publisher:HOLT MCDOUGAL
Chapter11: Data Analysis And Probability
Section: Chapter Questions
Problem 8CR

Related questions
Question
Please show work on paper
Transcribed Image Text:In 1980 and again in 2010, a Gallup poll asked a random sample of 1000 US citizens "Are you in
favor of the death penalty for a person convicted of murder?" In 1980, the proportion saying yes
was 0.66. In 2010, it was 0.64. Does this data provide evidence that the proportion of US citizens
favoring the death penalty was higher in 1980 than it was in 2010? Use pi for the proportion in
1980 and p2 for the proportion in 2010.
(1) State the null and alternative hypotheses:
(2) What is the sample statistic?
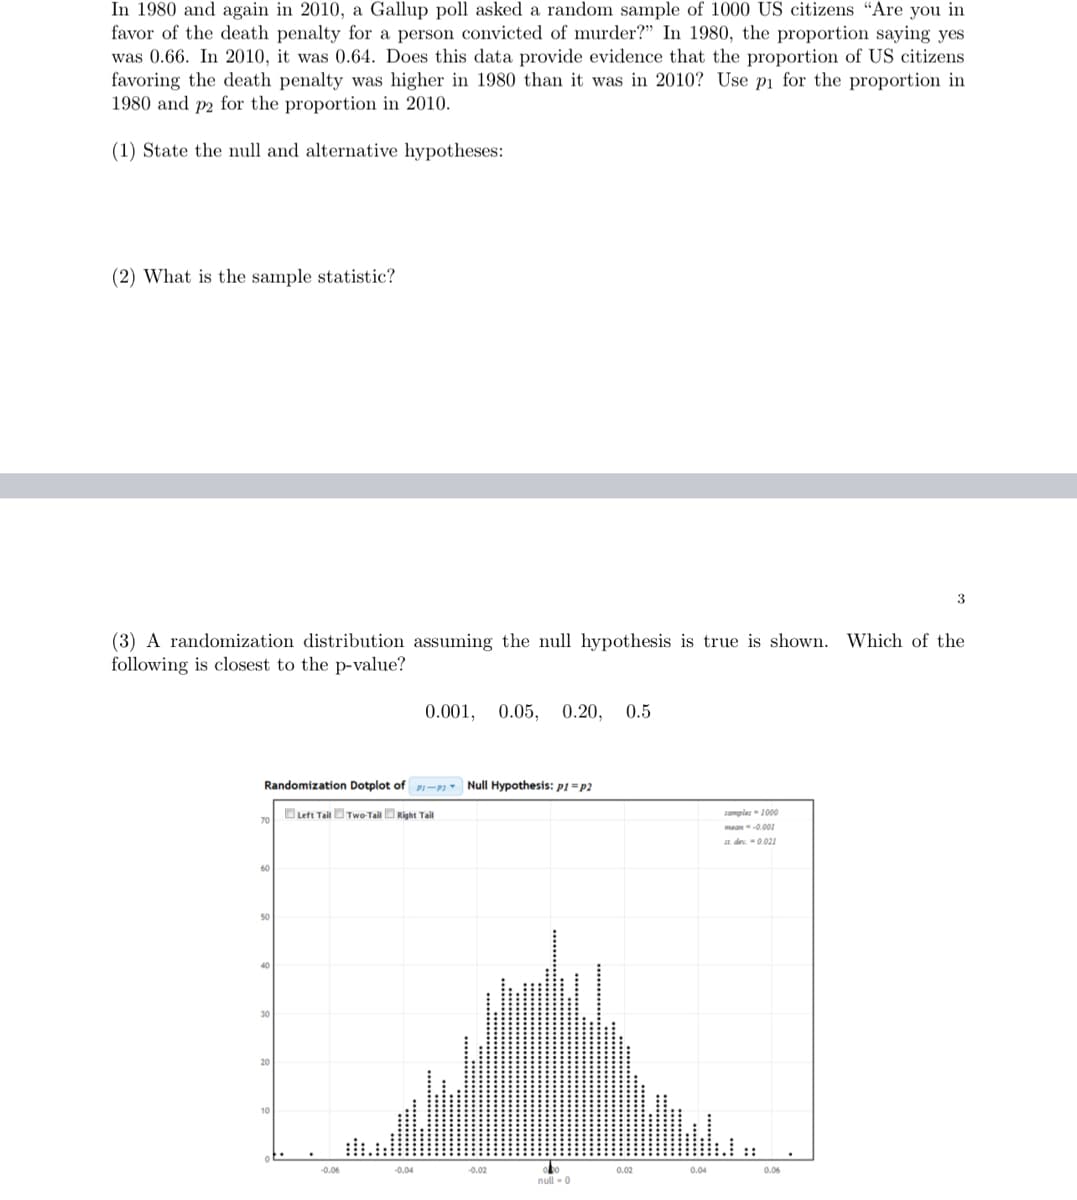
(3) A randomization distribution assuming the null hypothesis is true is shown. Which of the
following is closest to the p-value?
Randomization Dotplot of P-Null Hypothesis: p1=p2
Left Tail Two-Tail Right Tail
70
50
40
30
20
-0.06
0.001, 0.05, 0.20, 0.5
-0.04
-0.02
obo
null - 0
0.02
0.04
samples-1000
mean--0.001
at dev = 0.021
3
0.06
Expert Solution
This question has been solved!
Explore an expertly crafted, step-by-step solution for a thorough understanding of key concepts.

This is a popular solution!

Trending now
This is a popular solution!

Step by step
Solved in 3 steps with 3 images

Recommended textbooks for you
Holt Mcdougal Larson Pre-algebra: Student Edition…
Algebra
ISBN:
9780547587776
Author:
HOLT MCDOUGAL
Publisher:
HOLT MCDOUGAL

Glencoe Algebra 1, Student Edition, 9780079039897…
Algebra
ISBN:
9780079039897
Author:
Carter
Publisher:
McGraw Hill
Holt Mcdougal Larson Pre-algebra: Student Edition…
Algebra
ISBN:
9780547587776
Author:
HOLT MCDOUGAL
Publisher:
HOLT MCDOUGAL
Glencoe Algebra 1, Student Edition, 9780079039897…
Algebra
ISBN:
9780079039897
Author:
Carter
Publisher:
McGraw Hill