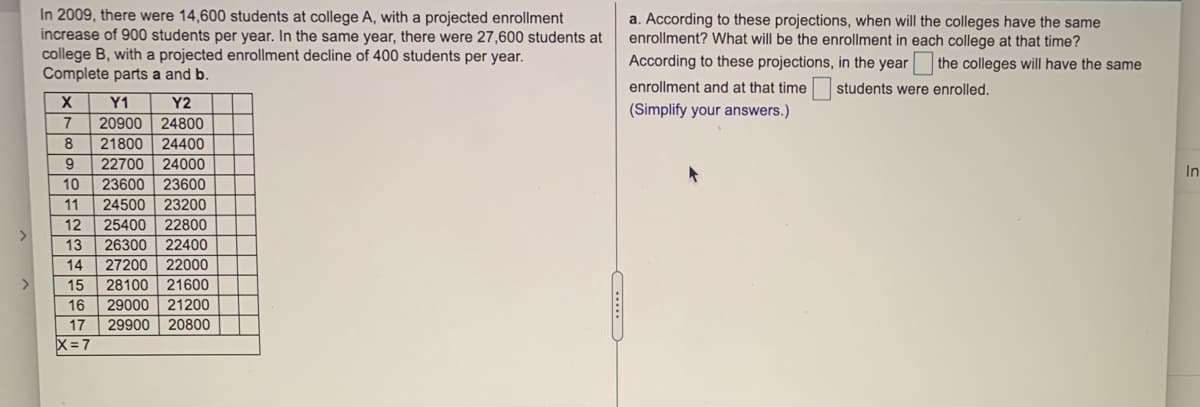
In 2009, there were 14,600 students at college A, with a projected enrollment increase of 900 students per year. In the same year, there were 27,600 students at college B, with a projected enrollment decline of 400 students per year. Complete parts a and b. a. According to these projections, when will the colleges have the same enrollment? What will be the enrollment in each college at that time? According to these projections, in the year the colleges will have the same enrollment and at that time students were enrolled. Y1 Y2 (Simplify your answers.) 7. 20900 24800 8. 21800 24400 9. 22700 24000 10 23600 23600 11 24500 23200 12 25400 22800 26300 27200 28100 21600 13 22400 14 22000 <> 15 29000 21200 29900 20800 16 17 X= 7 ....
In 2009, there were 14,600 students at college A, with a projected enrollment increase of 900 students per year. In the same year, there were 27,600 students at college B, with a projected enrollment decline of 400 students per year. Complete parts a and b. a. According to these projections, when will the colleges have the same enrollment? What will be the enrollment in each college at that time? According to these projections, in the year the colleges will have the same enrollment and at that time students were enrolled. Y1 Y2 (Simplify your answers.) 7. 20900 24800 8. 21800 24400 9. 22700 24000 10 23600 23600 11 24500 23200 12 25400 22800 26300 27200 28100 21600 13 22400 14 22000 <> 15 29000 21200 29900 20800 16 17 X= 7 ....

Glencoe Algebra 1, Student Edition, 9780079039897, 0079039898, 2018
18th Edition
ISBN:9780079039897
Author:Carter
Publisher:Carter
Chapter6: Systems Of Linear Equations And Inequalities
Section: Chapter Questions
Problem 3SGR

Related questions

Concept explainers
Contingency Table
A contingency table can be defined as the visual representation of the relationship between two or more categorical variables that can be evaluated and registered. It is a categorical version of the scatterplot, which is used to investigate the linear relationship between two variables. A contingency table is indeed a type of frequency distribution table that displays two variables at the same time.
Binomial Distribution
Binomial is an algebraic expression of the sum or the difference of two terms. Before knowing about binomial distribution, we must know about the binomial theorem.
Topic Video
Question
7
Transcribed Image Text:In 2009, there were 14,600 students at college A, with a projected enrollment
increase of 900 students per year. In the same year, there were 27,600 students at
a. According to these projections, when will the colleges have the same
enrollment? What will be the enrollment in each college at that time?
college B, with a projected enrollment decline of 400 students per year.
Complete parts a and b.
According to these projections, in the year the colleges will have the same
enrollment and at that time
students were enrolled.
Y1
Y2
(Simplify your answers.)
7.
20900
24800
8.
21800
24400
9.
22700 24000
In
10
23600
23600
11
24500
23200
12
25400
22800
<>
13
26300
22400
14
27200
22000
<>
15
28100
21600
16
29000 21200
17
29900 20800
X=7
Expert Solution
This question has been solved!
Explore an expertly crafted, step-by-step solution for a thorough understanding of key concepts.

This is a popular solution!

Trending now
This is a popular solution!

Step by step
Solved in 2 steps

Knowledge Booster


Learn more about
Need a deep-dive on the concept behind this application? Look no further. Learn more about this topic, algebra and related others by exploring similar questions and additional content below.Recommended textbooks for you
Glencoe Algebra 1, Student Edition, 9780079039897…
Algebra
ISBN:
9780079039897
Author:
Carter
Publisher:
McGraw Hill

Linear Algebra: A Modern Introduction
Algebra
ISBN:
9781285463247
Author:
David Poole
Publisher:
Cengage Learning

College Algebra (MindTap Course List)
Algebra
ISBN:
9781305652231
Author:
R. David Gustafson, Jeff Hughes
Publisher:
Cengage Learning
Glencoe Algebra 1, Student Edition, 9780079039897…
Algebra
ISBN:
9780079039897
Author:
Carter
Publisher:
McGraw Hill
Linear Algebra: A Modern Introduction
Algebra
ISBN:
9781285463247
Author:
David Poole
Publisher:
Cengage Learning
College Algebra (MindTap Course List)
Algebra
ISBN:
9781305652231
Author:
R. David Gustafson, Jeff Hughes
Publisher:
Cengage Learning

Algebra for College Students
Algebra
ISBN:
9781285195780
Author:
Jerome E. Kaufmann, Karen L. Schwitters
Publisher:
Cengage Learning

Algebra & Trigonometry with Analytic Geometry
Algebra
ISBN:
9781133382119
Author:
Swokowski
Publisher:
Cengage
