In 2017, Americans spent a record-high $9.1 billion on Halloween-related purchases (the balance website). Sample data showing the amount, in dollars, 16 adults spent on a Halloween costume are as follows. 14 68 25 64 31 33 32 44 50 15 16 96 46 35 64 28 a. What is the estimate of the population mean amount adults spend on a Halloween costume (to 2 decimals)? $ b. What is the sample standard deviation (to 2 decimals)? $ c. Provide a 95% confidence interval estimate of the population standard deviation for the amount adults spend on a Halloween costume (to 2 decimals). Use Table 11.1. so≤8 $
In 2017, Americans spent a record-high $9.1 billion on Halloween-related purchases (the balance website). Sample data showing the amount, in dollars, 16 adults spent on a Halloween costume are as follows. 14 68 25 64 31 33 32 44 50 15 16 96 46 35 64 28 a. What is the estimate of the population mean amount adults spend on a Halloween costume (to 2 decimals)? $ b. What is the sample standard deviation (to 2 decimals)? $ c. Provide a 95% confidence interval estimate of the population standard deviation for the amount adults spend on a Halloween costume (to 2 decimals). Use Table 11.1. so≤8 $

Glencoe Algebra 1, Student Edition, 9780079039897, 0079039898, 2018
18th Edition
ISBN:9780079039897
Author:Carter
Publisher:Carter
Chapter10: Statistics
Section10.4: Distributions Of Data
Problem 19PFA

Related questions
Question
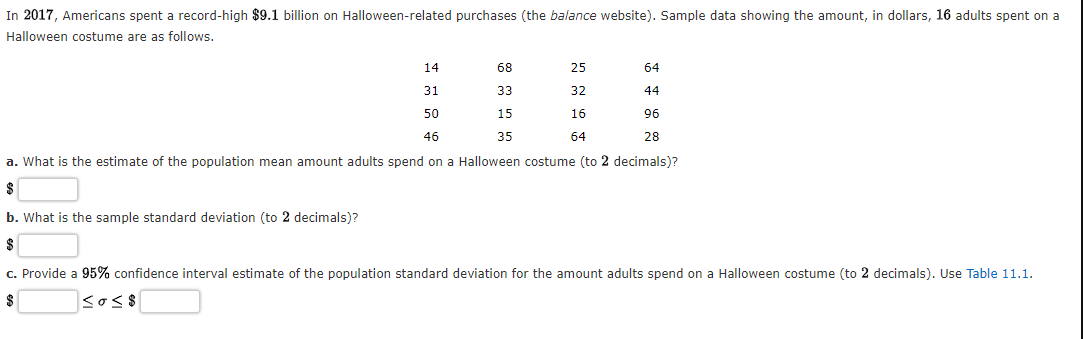
Transcribed Image Text:In 2017, Americans spent a record-high $9.1 billion on Halloween-related purchases (the balance website). Sample data showing the amount, in dollars, 16 adults spent on a
Halloween costume are as follows.
14
68
25
64
31
33
32
44
50
15
16
96
46
35
64
28
a. What is the estimate of the population mean amount adults spend on a Halloween costume (to 2 decimals)?
$
b. What is the sample standard deviation (to 2 decimals)?
$
c. Provide a 95% confidence interval estimate of the population standard deviation for the amount adults spend on a Halloween costume (to 2 decimals). Use Table 11.1.
sos$
$
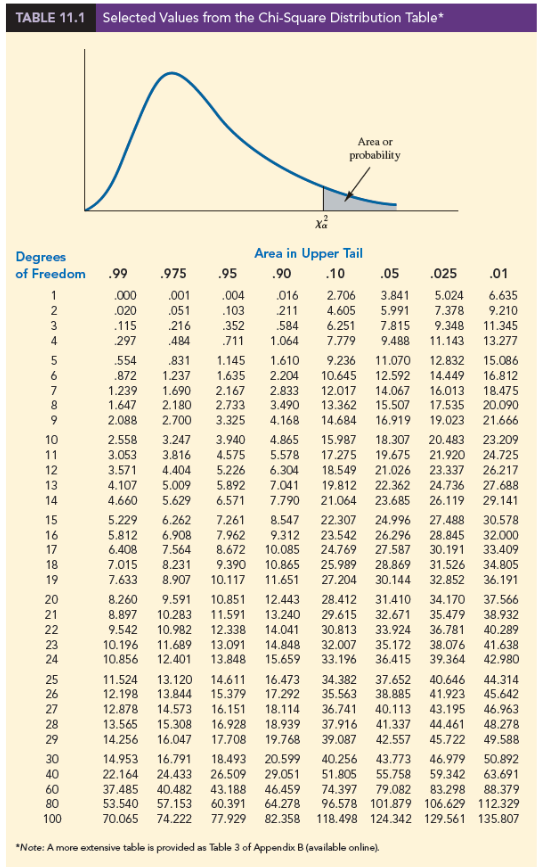
Transcribed Image Text:TABLE 11.1 Selected Values from the Chi-Square Distribution Table*
Area or
probability
Degrees
of Freedom
.99
.975
1
Xa
Area in Upper Tail
.95
.90
.10
.05
.01
.000
.001
.004
.016
2.706
3.841
5.024
6.635
.020 .051
.103
211 4.605
5.991 7.378
9.210
.115
.216
.352
584
6.251
7.815 9.348 11.345
297 .484
.711
1.064
7.779
9.488 11.143
13.277
.554
.831
1.145
1.610
9.236 11.070 12.832
15.086
1.635
2.204
10.645 12.592 14.449 16.812
2.833 12.017 14.067 16.013
2.167
18.475
15.507 17.535 20.090
2.733
3.490
13.362
3.325
4.168
14.684
16.919 19.023 21.666
.872 1.237
1.239 1.690
1.647 2.180
2.088 2.700
2.558 3.247
3.053 3.816
3.571 4.404
4.107 5.009
4.660 5.629
3.940
4.865
15.987
18.307 20.483 23.209
24.725
17.275 19.675 21.920
4.575 5.578
5.226 6.304
5.892
18.549 21.026 23.337
26.217
7.041
19.812 22.362
24.736
27.688
6.571
7.790
21.064 23.685 26.119
29.141
7.261 8.547
22.307 24.996 27.488
30.578
7.962
9.312
23.542 26.296 28.845
32.000
8.672
10.085
24.769 27.587
30.191 33.409
9.390
10.865
25.989 28.869
31.526 34.805
10.117
11.651
27.204
30.144 32.852 36.191
28.412 31.410 34.170
37.566
38.932
5.229 6.262
5.812 6.908
6.408 7.564
7.015 8.231
7.633 8.907
8.260 9.591
8.897 10.283
9.542 10.982
10.196 11.689
10.856 12.401
11.524 13.120
12.198 13.844
12.878 14.573 16.151
13.565 15.308 16.928
10.851 12.443
11.591 13.240
12.338 14.041
13.091 14.848
13.848 15.659
40.289
29.615 32.671 35.479
30.813 33.924 36.781
32.007 35.172 38.076
39.364
41.638
33.196 36.415
42.980
14.611
16.473
34.382 37.652 40.646 44.314
26
15.379
17.292
35.563 38.885 41.923 45.642
36.741 40.113 43.195 46.963
27
18.114
28
29
37.916 41.337 44.461 48.278
39.087 42.557
49.588
45.722
43.773 46.979 50.892
14.953 16.791
18.939
14.256 16.047 17.708 19.768
18.493 20.599
22.164
26.509 29.051
37.485 40.482 43.188 46.459
74.397 79.082 83.298 88.379
53.540 57.153 60.391 64.278 96.578 101.879 106.629 112.329
100 70.065 74.222 77.929 82.358 118.498 124.342 129.561 135.807
40.256
51.805
40
24.433
55.758 59.342 63.691
80
*Note: A more extensive table is provided as Table 3 of Appendix B (available online).
234
SATHY DONNA SCAR 22 ~ 29288
5
6
7
8
9
10
11
12
13
14
15
16
17
18
19
20
21
23
24
25
30
60
.025
Expert Solution
This question has been solved!
Explore an expertly crafted, step-by-step solution for a thorough understanding of key concepts.

This is a popular solution!

Trending now
This is a popular solution!

Step by step
Solved in 4 steps with 1 images

Recommended textbooks for you
Glencoe Algebra 1, Student Edition, 9780079039897…
Algebra
ISBN:
9780079039897
Author:
Carter
Publisher:
McGraw Hill
Glencoe Algebra 1, Student Edition, 9780079039897…
Algebra
ISBN:
9780079039897
Author:
Carter
Publisher:
McGraw Hill