In a 4-week study about the effectiveness of Do you Feel Better? using magnetic insoles to treat plantar heel pain, 52 subjects wore magnetic insoles and 48 subjects wore nonmagnetic insoles. The results are shown at the right. At a = 0.09, can you support the claim that there is a difference in the proportion of subjects who feel better between the two groups? Assume the random samples are independent. Complete parts (a) through Magnetic Insoles Yes 15 I No 37 Nonmagnetic nsolesres 18 INo 30 (a) Identify the claim and state Ho and Ha. The claim is "the proportion of subjects who feel better with magnetic insoles is those who feel better with nonmagnetic insoles." Let p, represent the population proportion for the magnetic insoles and p, represent the population proportions for the nonmagnetic insoles. State Ho and Ha. Choose the correct answer below. O A. Ho: P12 P2 OC. Ho: P1 P2 Ha: P1 SP2 OB. Ho: P1 = P2 Ha: P1 *P2 Hai P1 P2 OE. Ho: P1 #P2 Ha: P1 = P2 (b) Find the critical value(s) and identify the rejection region(s). The critical value(s) is(are)O (Use a comma to separate answers as needed. Type an integer or a decimal. Round to two decimal places as needed.) Identify the rejection region(s). Select the correct choice below and fill in the answer box(es) within your choice. (Round to two decimal places as needed.) O A. z< OB. z> oc. OD. 75 and z>
In a 4-week study about the effectiveness of Do you Feel Better? using magnetic insoles to treat plantar heel pain, 52 subjects wore magnetic insoles and 48 subjects wore nonmagnetic insoles. The results are shown at the right. At a = 0.09, can you support the claim that there is a difference in the proportion of subjects who feel better between the two groups? Assume the random samples are independent. Complete parts (a) through Magnetic Insoles Yes 15 I No 37 Nonmagnetic nsolesres 18 INo 30 (a) Identify the claim and state Ho and Ha. The claim is "the proportion of subjects who feel better with magnetic insoles is those who feel better with nonmagnetic insoles." Let p, represent the population proportion for the magnetic insoles and p, represent the population proportions for the nonmagnetic insoles. State Ho and Ha. Choose the correct answer below. O A. Ho: P12 P2 OC. Ho: P1 P2 Ha: P1 SP2 OB. Ho: P1 = P2 Ha: P1 *P2 Hai P1 P2 OE. Ho: P1 #P2 Ha: P1 = P2 (b) Find the critical value(s) and identify the rejection region(s). The critical value(s) is(are)O (Use a comma to separate answers as needed. Type an integer or a decimal. Round to two decimal places as needed.) Identify the rejection region(s). Select the correct choice below and fill in the answer box(es) within your choice. (Round to two decimal places as needed.) O A. z< OB. z> oc. OD. 75 and z>

Holt Mcdougal Larson Pre-algebra: Student Edition 2012
1st Edition
ISBN:9780547587776
Author:HOLT MCDOUGAL
Publisher:HOLT MCDOUGAL
Chapter11: Data Analysis And Probability
Section: Chapter Questions
Problem 8CR

Related questions

Topic Video
Question
|
In a 4-week study about the effectiveness of using magnetic insoles to treat plantar heel pain,
52
subjects wore magnetic insoles and
48
subjects wore nonmagnetic insoles. The results are shown at the right. At
α=0.09,
can you support the claim that there is a difference in the proportion of subjects who feel better between the twogroups? Assume the random samples are independent. Complete parts (a) through (e). |
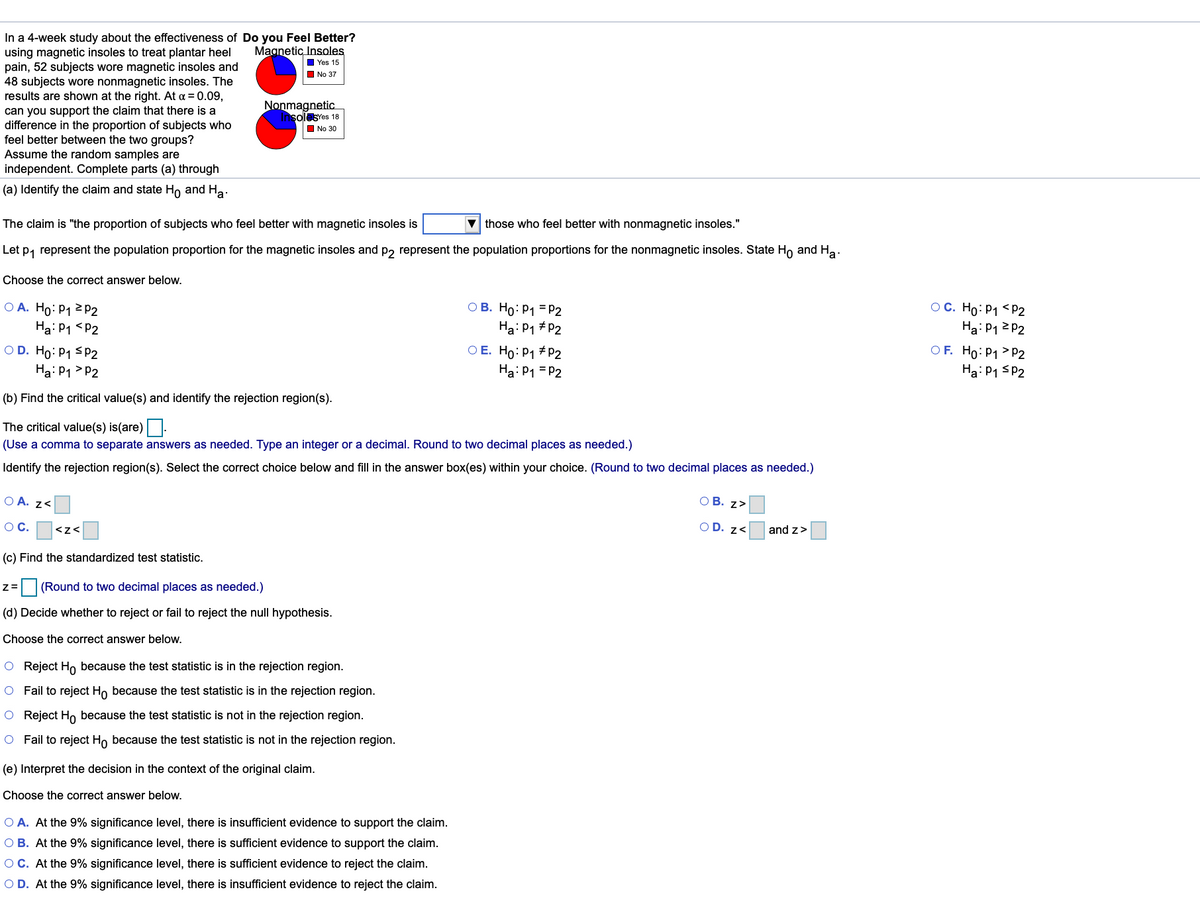
Transcribed Image Text:In a 4-week study about the effectiveness of Do you Feel Better?
using magnetic insoles to treat plantar heel
pain, 52 subjects wore magnetic insoles and
48 subjects wore nonmagnetic insoles. The
results are shown at the right. At a = 0.09,
can you support the claim that there is a
difference in the proportion of subjects who
feel better between the two groups?
Assume the random samples are
independent. Complete parts (a) through
Magnetic Insoles
Yes 15
O No 37
Nonmagnetic
InsolesYes 18
O No 30
(a) Identify the claim and state H, and Ha
The claim is "the proportion of subjects who feel better with magnetic insoles is
V those who feel better with nonmagnetic insoles."
Let p, represent the population proportion for the magnetic insoles and p, represent the population proportions for the nonmagnetic insoles. State Ho and Ha.
Choose the correct answer below.
OC. Ho: P1 <P2
Ha: P1 2 P2
OF. Ho: P1> P2
Ha: P1 sP2
О А. Но: Р1 2 Р2
Ha: P1 <P2
О В. Но: Р1 -р2
Ha: P1 # P2
O D. Ho: P1 SP2
Ha: P1 > P2
O E. Ho: P1 #P2
Ha: P1 = P2
(b) Find the critical value(s) and identify the rejection region(s).
The critical value(s) is(are) .
(Use a comma to separate answers as needed. Type an integer or a decimal. Round to two decimal places as needed.)
Identify the rejection region(s). Select the correct choice below and fill in the answer box(es) within your choice. (Round to two decimal places as needed.)
O A. z<
ОВ. z>
OC.
O D. z<
and z>
<z<
(c) Find the standardized test statistic.
(Round to two decimal places as needed.)
(d) Decide whether to reject or fail to reject the null hypothesis.
Choose the correct answer below.
O Reject Ho because the test statistic is in the rejection region.
O Fail to reject Ho because the test statistic is in the rejection region.
O Reject Ho because the test statistic is not in the rejection region.
O Fail to reject Ho because the test statistic is not in the rejection region.
(e) Interpret the decision in the context of the original claim.
Choose the correct answer below.
O A. At the 9% significance level, there is insufficient evidence to support the claim.
O B. At the 9% significance level, there is sufficient evidence to support the claim.
OC. At the 9% significance level, there is sufficient evidence to reject the claim.
O D. At the 9% significance level, there is insufficient evidence to reject the claim.
Expert Solution
This question has been solved!
Explore an expertly crafted, step-by-step solution for a thorough understanding of key concepts.

This is a popular solution!

Trending now
This is a popular solution!

Step by step
Solved in 3 steps with 6 images

Knowledge Booster


Learn more about
Need a deep-dive on the concept behind this application? Look no further. Learn more about this topic, statistics and related others by exploring similar questions and additional content below.Recommended textbooks for you
Holt Mcdougal Larson Pre-algebra: Student Edition…
Algebra
ISBN:
9780547587776
Author:
HOLT MCDOUGAL
Publisher:
HOLT MCDOUGAL
Holt Mcdougal Larson Pre-algebra: Student Edition…
Algebra
ISBN:
9780547587776
Author:
HOLT MCDOUGAL
Publisher:
HOLT MCDOUGAL