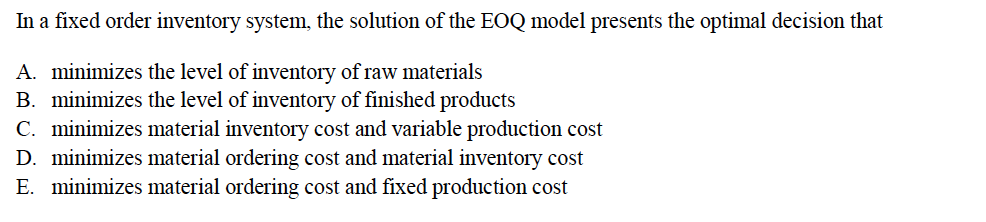
In a fixed order inventory system, the solution of the EOQ model presents the optimal decision that A. minimizes the level of inventory of raw materials B. minimizes the level of inventory of finished products C. minimizes material inventory cost and variable production cost D. minimizes material ordering cost and material inventory cost E. minimizes material ordering cost and fixed production cost


Q: Single-period. This type of problem can be recognized when a probability distribution or empirical…
A: Ce = $500 Cs =? Optimal spare parts = 2
Q: Daily demand for fresh cauliflower in the ZZ-Warehouse store follows normal distribution with mean…
A: Given that: Mean (μ) = 100 Standard Deviation (σ) = 20 Cost = $50 Selling Price = $70 Salvage cost =…
Q: Lindsay Electronics, a small manufacturer of electronic research equipment, has approximately 7,100…
A: From the above given information, Amount of the items according to their percentages are, A items…
Q: [item no. 11] In a single period inventory model, the demand is assumed to follow a normal…
A: The single period inventory model refers to the inventory model in which the inventory does not…
Q: t goods department of a large department store sells 175 units per month of a certain large bath…
A: Annual Demand (D)= 175*12=2100 units Unit cost(C)=$2.50 Cost of placing order=$12.00 Carry cost=27%
Q: a) The reorder quantity/ EOQ/ ROQ b) Ordering Cost c) Holding Cost
A: Since you have posted a question with multiple sub-parts, we will solve the first three subparts for…
Q: 2. An electronic component manufacturer produces supercapacitors. They are sold at a steady rate of…
A: The question is related to the Inventory Management. The Optimum order quantity will be calculated…
Q: A company would like to classify its inventory systems using ABC inventory classification system.…
A: Item Demand Per unit price Revenue Revenue % Cumulative XYZ4 577…
Q: 2. The maintenance department of a large hospital uses about 3100 cases of liquid cleanser annually.…
A: Ordering cost refers to the cost that gets incurred while creating and processing an order to a…
Q: A company would like to classify its inventory systems using ABC inventory classification system.…
A: Let us formulate the table as below: Inventory items Annual Demands Price per unit Total price…
Q: A company would like to classify its inventory systems using ABC Inventory classification system.…
A: Introduction: The term Business refers to an exchange of goods and services between the buyer and…
Q: The difference(s) between the basic EOQ model and the pro-duction order quantity model is (are)…
A: In inventory management, economic order quantity(EOQ) is the order quantity that reduces the…
Q: The soft goods department of a large department store sells 175 units per month of a certain large…
A: Here, we have got following data, these are like Annual demand=175*12=2100 Unit cost=2.50 Order…
Q: The materials manager of a tire manfacturer must predict periodically place order for a key chemical…
A: The reorder purpose (ROP) is that the level of inventory that triggers associate action to refill…
Q: Square City Appliance orders four types of washing machines. Table 7 gives the annual demand,…
A: Based on the table data, I have calculated Economic Order Quantity or EOQ, Order cost, Holding cost,…
Q: 4) The H.A.L. Computer Store sells a printer for $200. Demand for this is constant during the year,…
A: We will first calculate the current cost incurred and then compare it with the EOQ.
Q: a- What is the optimal order quantity and the optimal total ordering and holding cost? b.If the…
A: Following are the data as given in the question, these are annual demand, Holding cost per year per…
Q: In the EOQ model, determining the optimal order quantity requires us to ______. a increase number of…
A: Note: We are answering question no. 1 as a question that needs to be answered is not mentioned.…
Q: Which of the following is an assumption of the EOQ model? A. The demand for the material may…
A: Economic order quantity is the optimum amount of any item that should be ordered so that the…
Q: 27- In the economic order quantity model, the optimal quantity (EOQ) is always…
A: The Economic Order Quantity (EOQ) refers to the ideal order quantity that a company should purchase…
Q: A distribution center (DC) in Wisconsin stocks Sony plasma TV sets. The center receives its…
A:
Q: Apply the EOQ model to the following quantity discount situation for which D5 500 units…
A: Given data, Annual Demand (D) = 500 units per year Co = 40 Annual holding cost rate = 20%…
Q: 6-40
A: Compute Safety stock:
Q: (a) Assume that all ingredients are ordered independently. For each ingredient, determine the…
A: Economic order quantity (EOQ) is a computation that businesses use to determine their ideal order…
Q: A company would like to classify its inventory systems using ABC inventory classification system.…
A: Given information, Cumulative budget assigned to A class inventory = 80% Cumulative budget assigned…
Q: We are given the following information for a product:Order cost $50Annual demand N(960,…
A:
Q: A company would like to classify its inventory systems using ABC inventory classification system.…
A: Option (d) is correct.
Q: A company would like to classify its inventory systems using ABC inventory classification system.…
A: ABC analysis:It is an approach for analyzing inventory items based on the product's consumption…
Q: The inventory management costs for a certain product are S = $8 to order, and H = $1 to hold for a…
A: The detailed solution of the answer is given in step 2.
Q: a. Using this data, compute the solutions using the Lot for Lot and Periodic Order Quantity…
A: Below is the solution:-
Q: The maintenance department in Ranchi Hospital uses 816 cases of liquid cleanser annually. Ordering…
A: The optimal quantity a corporation should purchase to minimize inventory expenditures, such as…
Q: Lebar Daun Sdn Bhd is planning to use the economic order quantity model to determine the optimal…
A: firstly we have to find the eoq i.e economic order quantity which is denoted by R and for that…
Q: of carrying one jacket in inventory for one year is 0.40. The given solution is this: 200 =…
A: Given: Setup cost=$2.00 Number of jackets=4000 optimal production cost=200 cost of carrying?
Q: A national chain of tyre fitters (tiger wheel and tyres) stocks a popular tyre for which the…
A: This question is related to the topic-Inventory Management and this topic falls under the operations…
Q: Surge Electric uses 4,000 toggle switches a year. Switches are priced as follows: 1 to 499, 90cents…
A:
Q: 53. Average demand for a particular item is 1,200 units per year. It costs $100 to place an ord for…
A: Given- Annual Demand (D)= 1200 units Ordering or Setup Cost (S)= $100 Holding Cost (H) = $24 per…
Q: In a fixed order inventory system, the solution of the EOQ model presents the optimal decision that…
A: The ordering costs are the costs incurred during the purchase of resources and materials from the…
Q: The difference(s) between the basic EOQ model and theproduction order quantity model is(are) that:a)…
A: Option (a) is the correct answer, here. The difference between the basic EOQ model and the…
Q: A firm incurs $30 in fixed order costs per order and a holding cost per unit of $1per year. Annual…
A: Annual Demand = D = 10,000 units Ordering Cost = O = $30 per order Holding Cost = H = $1 per unit…
Q: Show that the optimal order quantity for the backloggeddemand model is always at least as large as…
A: For Optimal order quantity Let , Optimum order quantity = OQ Maximum inventory level = M…
Q: 1. Maxmin Trading Company buys 1,000 pcs of chair per month. The cost per chair is Php500 and…
A: Since you have asked multiple questions, we will solve the first question for you. If you want any…
Q: 8. James Beerd bakes cheesecakes and Black Forest cakes. During any month, he can bake at most 65…
A:
Q: An organization manufactures supplies for landscaping companies which has an annual demand of…
A: EOQ is a company's optimal order quantity that underestimates the total costs related to ordering,…
Q: Total Stock Administration costs under the EOQ model is the sum of: Select one: a. Carrying costs…
A: Administrative cost refers to the overhead cost that is incurred by the organization not directly…
Q: d If Bruno's storage vessel can hold only 3500 kg of milk, what would be Bruno's annual ordering and…
A: As per Bartleby guidelines, we can only solve the three subparts of one question at a time...Kindly…
Q: 8. 4 The Western Jeans Company purchases denim from Cumberland Textile Mills. The Western Jeans…
A: SOLUTION:
Q: A manufacturer of exercise equipment purchases pulleys from a supplier who lists these prices: less…
A: Annual Usage = D = 4900 pulleys Ordering cost = S = $50 Holding cost = 20% We will consider initial…
Q: A manufacturer of exercise equipment purchases the pulley section of the equipment from a supplier…
A:
Q: The company is considering the possibility of allowing backorders to occur for the product. Find the…
A: THE ANSWER IS AS BELOW:
Please choose the most correct anwer. There could be more than one. Thanks!

Step by step
Solved in 2 steps

- The eTech Company is a fairly recent entry in the electronic device area. The company competes with Apple. Samsung, and other well-known companies in the manufacturing and sales of personal handheld devices. Although eTech recognizes that it is a niche player and will likely remain so in the foreseeable future, it is trying to increase its current small market share in this huge competitive market. Jim Simons, VP of Production, and Catherine Dolans, VP of Marketing, have been discussing the possible addition of a new product to the companys current (rather limited) product line. The tentative name for this new product is ePlayerX. Jim and Catherine agree that the ePlayerX, which will feature a sleeker design and more memory, is necessary to compete successfully with the big boys, but they are also worried that the ePlayerX could cannibalize sales of their existing productsand that it could even detract from their bottom line. They must eventually decide how much to spend to develop and manufacture the ePlayerX and how aggressively to market it. Depending on these decisions, they must forecast demand for the ePlayerX, as well as sales for their existing products. They also realize that Apple. Samsung, and the other big players are not standing still. These competitors could introduce their own new products, which could have very negative effects on demand for the ePlayerX. The expected timeline for the ePlayerX is that development will take no more than a year to complete and that the product will be introduced in the market a year from now. Jim and Catherine are aware that there are lots of decisions to make and lots of uncertainties involved, but they need to start somewhere. To this end. Jim and Catherine have decided to base their decisions on a planning horizon of four years, including the development year. They realize that the personal handheld device market is very fluid, with updates to existing products occurring almost continuously. However, they believe they can include such considerations into their cost, revenue, and demand estimates, and that a four-year planning horizon makes sense. In addition, they have identified the following problem parameters. (In this first pass, all distinctions are binary: low-end or high-end, small-effect or large-effect, and so on.) In the absence of cannibalization, the sales of existing eTech products are expected to produce year I net revenues of 10 million, and the forecast of the annual increase in net revenues is 2%. The ePIayerX will be developed as either a low-end or a high-end product, with corresponding fixed development costs (1.5 million or 2.5 million), variable manufacturing costs ( 100 or 200). and selling prices (150 or 300). The fixed development cost is incurred now, at the beginning of year I, and the variable cost and selling price are assumed to remain constant throughout the planning horizon. The new product will be marketed either mildly aggressively or very aggressively, with corresponding costs. The costs of a mildly aggressive marketing campaign are 1.5 million in year 1 and 0.5 million annually in years 2 to 4. For a very aggressive campaign, these costs increase to 3.5 million and 1.5 million, respectively. (These marketing costs are not part of the variable cost mentioned in the previous bullet; they are separate.) Depending on whether the ePlayerX is a low-end or high-end produce the level of the ePlayerXs cannibalization rate of existing eTech products will be either low (10%) or high (20%). Each cannibalization rate affects only sales of existing products in years 2 to 4, not year I sales. For example, if the cannibalization rate is 10%, then sales of existing products in each of years 2 to 4 will be 10% below their projected values without cannibalization. A base case forecast of demand for the ePlayerX is that in its first year on the market, year 2, demand will be for 100,000 units, and then demand will increase by 5% annually in years 3 and 4. This base forecast is based on a low-end version of the ePlayerX and mildly aggressive marketing. It will be adjusted for a high-end will product, aggressive marketing, and competitor behavior. The adjustments with no competing product appear in Table 2.3. The adjustments with a competing product appear in Table 2.4. Each adjustment is to demand for the ePlayerX in each of years 2 to 4. For example, if the adjustment is 10%, then demand in each of years 2 to 4 will be 10% lower than it would have been in the base case. Demand and units sold are the samethat is, eTech will produce exactly what its customers demand so that no inventory or backorders will occur. Table 2.3 Demand Adjustments When No Competing Product Is Introduced Table 2.4 Demand Adjustments When a Competing Product Is Introduced Because Jim and Catherine are approaching the day when they will be sharing their plans with other company executives, they have asked you to prepare an Excel spreadsheet model that will answer the many what-if questions they expect to be asked. Specifically, they have asked you to do the following: You should enter all of the given data in an inputs section with clear labeling and appropriate number formatting. If you believe that any explanations are required, you can enter them in text boxes or cell comments. In this section and in the rest of the model, all monetary values (other than the variable cost and the selling price) should be expressed in millions of dollars, and all demands for the ePlayerX should be expressed in thousands of units. You should have a scenario section that contains a 0/1 variable for each of the binary options discussed here. For example, one of these should be 0 if the low-end product is chosen and it should be 1 if the high-end product is chosen. You should have a parameters section that contains the values of the various parameters listed in the case, depending on the values of the 0/1 variables in the previous bullet For example, the fixed development cost will be 1.5 million or 2.5 million depending on whether the 0/1 variable in the previous bullet is 0 or 1, and this can be calculated with a simple IF formula. You can decide how to implement the IF logic for the various parameters. You should have a cash flows section that calculates the annual cash flows for the four-year period. These cash flows include the net revenues from existing products, the marketing costs for ePlayerX, and the net revenues for sales of ePlayerX (To calculate these latter values, it will help to have a row for annual units sold of ePlayerX.) The cash flows should also include depreciation on the fixed development cost, calculated on a straight-line four-year basis (that is. 25% of the cost in each of the four years). Then, these annual revenues/costs should be summed for each year to get net cash flow before taxes, taxes should be calculated using a 32% tax rate, and taxes should be subtracted and depreciation should be added back in to get net cash flows after taxes. (The point is that depreciation is first subtracted, because it is not taxed, but then it is added back in after taxes have been calculated.) You should calculate the company's NPV for the four-year horizon using a discount rate of 10%. You can assume that the fixed development cost is incurred now. so that it is not discounted, and that all other costs and revenues are incurred at the ends of the respective years. You should accompany all of this with a line chart with three series: annual net revenues from existing products; annual marketing costs for ePlayerX; and annual net revenues from sales of ePlayerX. Once all of this is completed. Jim and Catherine will have a powerful tool for presentation purposes. By adjusting the 0/1 scenario variables, their audience will be able to see immediately, both numerically and graphically, the financial consequences of various scenarios.Seas Beginning sells clothing by mail order. An important question is when to strike a customer from the companys mailing list. At present, the company strikes a customer from its mailing list if a customer fails to order from six consecutive catalogs. The company wants to know whether striking a customer from its list after a customer fails to order from four consecutive catalogs results in a higher profit per customer. The following data are available: If a customer placed an order the last time she received a catalog, then there is a 20% chance she will order from the next catalog. If a customer last placed an order one catalog ago, there is a 16% chance she will order from the next catalog she receives. If a customer last placed an order two catalogs ago, there is a 12% chance she will order from the next catalog she receives. If a customer last placed an order three catalogs ago, there is an 8% chance she will order from the next catalog she receives. If a customer last placed an order four catalogs ago, there is a 4% chance she will order from the next catalog she receives. If a customer last placed an order five catalogs ago, there is a 2% chance she will order from the next catalog she receives. It costs 2 to send a catalog, and the average profit per order is 30. Assume a customer has just placed an order. To maximize expected profit per customer, would Seas Beginning make more money canceling such a customer after six nonorders or four nonorders?Suppose that GLC earns a 2000 profit each time a person buys a car. We want to determine how the expected profit earned from a customer depends on the quality of GLCs cars. We assume a typical customer will purchase 10 cars during her lifetime. She will purchase a car now (year 1) and then purchase a car every five yearsduring year 6, year 11, and so on. For simplicity, we assume that Hundo is GLCs only competitor. We also assume that if the consumer is satisfied with the car she purchases, she will buy her next car from the same company, but if she is not satisfied, she will buy her next car from the other company. Hundo produces cars that satisfy 80% of its customers. Currently, GLC produces cars that also satisfy 80% of its customers. Consider a customer whose first car is a GLC car. If profits are discounted at 10% annually, use simulation to estimate the value of this customer to GLC. Also estimate the value of a customer to GLC if it can raise its customer satisfaction rating to 85%, to 90%, or to 95%. You can interpret the satisfaction value as the probability that a customer will not switch companies.
- If a monopolist produces q units, she can charge 400 4q dollars per unit. The variable cost is 60 per unit. a. How can the monopolist maximize her profit? b. If the monopolist must pay a sales tax of 5% of the selling price per unit, will she increase or decrease production (relative to the situation with no sales tax)? c. Continuing part b, use SolverTable to see how a change in the sales tax affects the optimal solution. Let the sales tax vary from 0% to 8% in increments of 0.5%.Although the normal distribution is a reasonable input distribution in many situations, it does have two potential drawbacks: (1) it allows negative values, even though they may be extremely improbable, and (2) it is a symmetric distribution. Many situations are modelled better with a distribution that allows only positive values and is skewed to the right. Two of these that have been used in many real applications are the gamma and lognormal distributions. @RISK enables you to generate observations from each of these distributions. The @RISK function for the gamma distribution is RISKGAMMA, and it takes two arguments, as in =RISKGAMMA(3,10). The first argument, which must be positive, determines the shape. The smaller it is, the more skewed the distribution is to the right; the larger it is, the more symmetric the distribution is. The second argument determines the scale, in the sense that the product of it and the first argument equals the mean of the distribution. (The mean in this example is 30.) Also, the product of the second argument and the square root of the first argument is the standard deviation of the distribution. (In this example, it is 3(10=17.32.) The @RISK function for the lognormal distribution is RISKLOGNORM. It has two arguments, as in =RISKLOGNORM(40,10). These arguments are the mean and standard deviation of the distribution. Rework Example 10.2 for the following demand distributions. Do the simulated outputs have any different qualitative properties with these skewed distributions than with the triangular distribution used in the example? a. Gamma distribution with parameters 2 and 85 b. Gamma distribution with parameters 5 and 35 c. Lognormal distribution with mean 170 and standard deviation 60Lemingtons is trying to determine how many Jean Hudson dresses to order for the spring season. Demand for the dresses is assumed to follow a normal distribution with mean 400 and standard deviation 100. The contract between Jean Hudson and Lemingtons works as follows. At the beginning of the season, Lemingtons reserves x units of capacity. Lemingtons must take delivery for at least 0.8x dresses and can, if desired, take delivery on up to x dresses. Each dress sells for 160 and Hudson charges 50 per dress. If Lemingtons does not take delivery on all x dresses, it owes Hudson a 5 penalty for each unit of reserved capacity that is unused. For example, if Lemingtons orders 450 dresses and demand is for 400 dresses, Lemingtons will receive 400 dresses and owe Jean 400(50) + 50(5). How many units of capacity should Lemingtons reserve to maximize its expected profit?
- When you use a RISKSIMTABLE function for a decision variable, such as the order quantity in the Walton model, explain how this provides a fair comparison across the different values tested.A Make-or-Buy DecisionTriple X Company manufactures and sells refrigerators. It makes some of the parts for the refrigerators and purchases others. The engineering department believes it might be possible to cut costs by manufacturing one of the parts currently being purchased for $8.25 each. The firm uses 100,000 of these parts each year. The accounting department compiles the following list of costs based on engineering estimates:Fixed costs will increase by $50,000.Labor costs will increase by $125,000.Factory overhead, currently running $500,000 per year, maybe expected to increase 12 percent.Raw materials used to make the part will cost $600,000.Given the preceding estimates, should Triple X make the part or continue to buy it?Sunblessed Juice Company sells bags oforanges and cartons of orange juice.Sunblessed grades oranges on a scale of 1(poor) to 10 (excellent). At present,-Sunblessed has 100,000 pounds of grade 9oranges and 120,000 pounds of grade 6 oranges on hand. The average quality of oranges sold in bags must be at least 7, and the average quality of the oranges used to produce orange juice must be at least 8. Each pound of oranges that is used for juice yields a revenue of $1.50 and incurs a variable cost (consisting of labor costs,variable overhead costs, inventory costs,and so on) of $1.05. Each pound of oranges sold in bags yields a revenue of $1.50 and incurs a variable cost of $0.70.a. Determine how Sunblessed can maximize its profit.b. Use SolverTable to determine how a change in the cost per bag of oranges changes the optimal -solution.c. Use SolverTable to determine how a change in the amount of grade 9 oranges available affects the -optimal solution.d. Use SolverTable to determine how a…