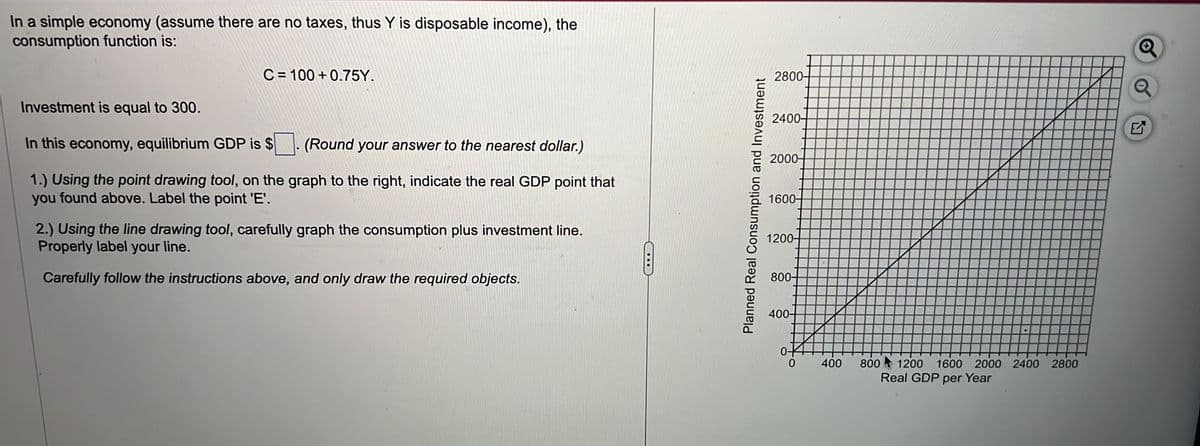
In a simple economy (assume there are no taxes, thus Y is disposable income), the consumption function is: C=100+0.75Y. Investment is equal to 300. In this economy, equilibrium GDP is $ (Round your answer to the nearest dollar.) 1.) Using the point drawing tool, on the graph to the right, indicate the real GDP point that you found above. Label the point 'E'. 2.) Using the line drawing tool, carefully graph the consumption plus investment line. Properly label your line. Carefully follow the instructions above, and only draw the required objects. Planned Real Consumption and Investment 2800- 2400+ 2000- 1600- 1200- 800- 400- 0 0 400 800 1200 1600 2000 2400 2800 Real GDP per Year Q Q
In a simple economy (assume there are no taxes, thus Y is disposable income), the consumption function is: C=100+0.75Y. Investment is equal to 300. In this economy, equilibrium GDP is $ (Round your answer to the nearest dollar.) 1.) Using the point drawing tool, on the graph to the right, indicate the real GDP point that you found above. Label the point 'E'. 2.) Using the line drawing tool, carefully graph the consumption plus investment line. Properly label your line. Carefully follow the instructions above, and only draw the required objects. Planned Real Consumption and Investment 2800- 2400+ 2000- 1600- 1200- 800- 400- 0 0 400 800 1200 1600 2000 2400 2800 Real GDP per Year Q Q
Chapter9: Demand-side Equilibrium: Unemployment Or Inflation?
Section: Chapter Questions
Problem 4TY
Related questions
Question
25

Transcribed Image Text:In a simple economy (assume there are no taxes, thus Y is disposable income), the
consumption function is:
C=100+0.75Y.
Investment is equal to 300.
In this economy, equilibrium GDP is $
(Round your answer to the nearest dollar.)
1.) Using the point drawing tool, on the graph to the right, indicate the real GDP point that
you found above. Label the point 'E'.
2.) Using the line drawing tool, carefully graph the consumption plus investment line.
Properly label your line.
Carefully follow the instructions above, and only draw the required objects.
C
Planned Real Consumption and Investment
2800+
2400-
2000-
1600-
1200+
800-
400-
0-
0
400
800 1200 1600 2000 2400 2800
Real GDP per Year
17
Expert Solution
This question has been solved!
Explore an expertly crafted, step-by-step solution for a thorough understanding of key concepts.
This is a popular solution!
Trending now
This is a popular solution!
Step by step
Solved in 2 steps with 1 images

Knowledge Booster
Learn more about
Need a deep-dive on the concept behind this application? Look no further. Learn more about this topic, economics and related others by exploring similar questions and additional content below.Recommended textbooks for you

