In a study conducted by the Department of Human Nutrition and Foods at Virginia Tech, the following data were recorded on sorbic acid residuals, in parts per million, in ham immediately after dipping in a sorbate solution and after 60 days of storage: Sorbic Acid Residuals in Ham Slice Before Storage After Storage 116 224 270 96 239 329 3 400 4 444 590 660 1400 680 437 597 689 576 Assuming the populations to be normally distributed, is there sufficient evidence, at the 0.05 level of significance, to say that the length of storage influences sorbic acid residual concentrations?
In a study conducted by the Department of Human Nutrition and Foods at Virginia Tech, the following data were recorded on sorbic acid residuals, in parts per million, in ham immediately after dipping in a sorbate solution and after 60 days of storage: Sorbic Acid Residuals in Ham Slice Before Storage After Storage 116 224 270 96 239 329 3 400 4 444 590 660 1400 680 437 597 689 576 Assuming the populations to be normally distributed, is there sufficient evidence, at the 0.05 level of significance, to say that the length of storage influences sorbic acid residual concentrations?

Glencoe Algebra 1, Student Edition, 9780079039897, 0079039898, 2018
18th Edition
ISBN:9780079039897
Author:Carter
Publisher:Carter
Chapter10: Statistics
Section10.6: Summarizing Categorical Data
Problem 31PPS

Related questions
Question
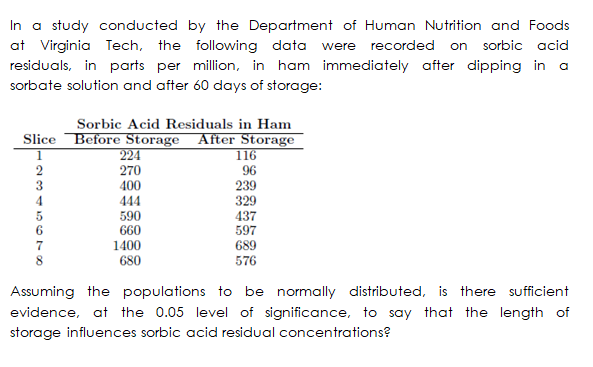
Transcribed Image Text:In a study conducted by the Department of Human Nutrition and Foods
at Virginia Tech, the following data were recorded on sorbic acid
residuals, in parts per million, in ham immediately after dipping in a
sorbate solution and after 60 days of storage:
Sorbic Acid Residuals in Ham
Slice Before Storage After Storage
224
116
2
3
4
270
400
444
96
239
329
590
660
1400
680
437
597
689
6.
7
8.
576
Assuming the populations to be normally distributed, is there sufficient
evidence, at the 0.05 level of significance, to say that the length of
storage influences sorbic acid residual concentrations?
Expert Solution
This question has been solved!
Explore an expertly crafted, step-by-step solution for a thorough understanding of key concepts.

This is a popular solution!

Trending now
This is a popular solution!

Step by step
Solved in 3 steps

Knowledge Booster


Learn more about
Need a deep-dive on the concept behind this application? Look no further. Learn more about this topic, probability and related others by exploring similar questions and additional content below.Recommended textbooks for you
Glencoe Algebra 1, Student Edition, 9780079039897…
Algebra
ISBN:
9780079039897
Author:
Carter
Publisher:
McGraw Hill
Glencoe Algebra 1, Student Edition, 9780079039897…
Algebra
ISBN:
9780079039897
Author:
Carter
Publisher:
McGraw Hill