In a study investigating the effect of car speed on accident severity, 5,000 reports of fatal automobile accidents were examined, and the vehicle speed at impact was recorded for each one. For these 5,000 accidents, the average speed was 54 mph and the standard deviation was 11 mph. A histogram revealed that the vehicle speed at impact distribution was approximately normal. (Use the Empirical Rule.) (a) Approximately what percentage of these vehide speeds were between 43 and 65 mph? (b) Approximately what percentage of these vehicle speeds exceeded 65 mph? Step 1 (a) Approximately what percentage of these vehide speeds were between 43 and 65 mph? Recall that per the Empirical Rule, if a data distribution is mound shaped and approximately symmetric, then: Approximately 68% of the observations fall within 1 standard deviation of the mean. Approximately 95% of the observations fall within 2 standard deviations of the mean. • Approximately 99.7% of the observations fall within 3 standard deviations of the mean. For this data distribution, it is given that the mean and standard deviation are x= 54 and s = 11. To find the approximate percentage of the vehicle speeds that were between 43 mph and 65 mph, first calculate how far 43 mph and 65 mph are from the mean. distance between the lower value and the mean - 43 43 - 54 -11 distance between the mean and the upper value = 65 65 - 54 = 11 11 Step 2 For the range 43 to 65 mph, the lower value is 11 less than the mean, and the upper value is 11 more than the mean. In other words, 43 is 1 standard deviation v below the mean, and 65 is 1 standard deviation v above the mean. This means that approximately X % of the vehicle speeds of fatal accidents at impact fall between the lower value of 43 mph and the upper value of 65 mph. 11
In a study investigating the effect of car speed on accident severity, 5,000 reports of fatal automobile accidents were examined, and the vehicle speed at impact was recorded for each one. For these 5,000 accidents, the average speed was 54 mph and the standard deviation was 11 mph. A histogram revealed that the vehicle speed at impact distribution was approximately normal. (Use the Empirical Rule.) (a) Approximately what percentage of these vehide speeds were between 43 and 65 mph? (b) Approximately what percentage of these vehicle speeds exceeded 65 mph? Step 1 (a) Approximately what percentage of these vehide speeds were between 43 and 65 mph? Recall that per the Empirical Rule, if a data distribution is mound shaped and approximately symmetric, then: Approximately 68% of the observations fall within 1 standard deviation of the mean. Approximately 95% of the observations fall within 2 standard deviations of the mean. • Approximately 99.7% of the observations fall within 3 standard deviations of the mean. For this data distribution, it is given that the mean and standard deviation are x= 54 and s = 11. To find the approximate percentage of the vehicle speeds that were between 43 mph and 65 mph, first calculate how far 43 mph and 65 mph are from the mean. distance between the lower value and the mean - 43 43 - 54 -11 distance between the mean and the upper value = 65 65 - 54 = 11 11 Step 2 For the range 43 to 65 mph, the lower value is 11 less than the mean, and the upper value is 11 more than the mean. In other words, 43 is 1 standard deviation v below the mean, and 65 is 1 standard deviation v above the mean. This means that approximately X % of the vehicle speeds of fatal accidents at impact fall between the lower value of 43 mph and the upper value of 65 mph. 11

Glencoe Algebra 1, Student Edition, 9780079039897, 0079039898, 2018
18th Edition
ISBN:9780079039897
Author:Carter
Publisher:Carter
Chapter10: Statistics
Section10.4: Distributions Of Data
Problem 19PFA

Related questions
Question
100%
ch4 q20
Transcribed Image Text:Tutorial Exercise
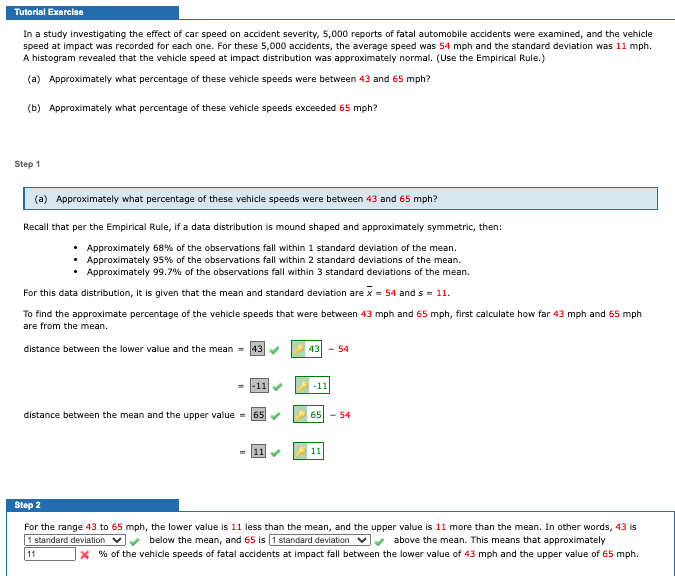
In a study investigating the effect of car speed on accident severity, 5,000 reports of fatal automobile accidents were examined, and the vehicle
speed at impact was recorded for each one. For these 5,000 accidents, the average speed was 54 mph and the standard deviation was 11 mph.
A histogram revealed that the vehicle speed at impact distribution was approximately normal. (Use the Empirical Rule.)
(a) Approximately what percentage of these vehicle speeds were between 43 and 65 mph?
(b) Approximately what percentage of these vehicle speeds exceeded 65 mph?
Step 1
(a) Approximately what percentage of these vehicle speeds were between 43 and 65 mph?
Recall that per the Empirical Rule, if a data distribution is mound shaped and approximately symmetric, then:
• Approximately 68% of the observations fall within 1 standard deviation of the mean.
Approximately 95% of the observations fall within 2 standard deviations of the mean.
Approximately 99.7% of the observations fall within 3 standard deviations of the mean.
For this data distribution, it is given that the mean and standard deviation are x = 54 and s = 11.
To find the approximate percentage of the vehicle speeds that were between 43 mph and 65 mph, first calculate how far 43 mph and 65 mph
are from the mean.
distance between the lower value and the mean = 43
43 - 54
-11
-11
distance between the mean and the upper value = 65
65 - 54
11
11
Step 2
For the range 43 to 65 mph, the lower value is 11 less than the mean, and the upper value is 11 more than the mean. In other words, 43 is
below the mean, and 65 is 1 standard deviation vy above the mean. This means that approximately
X % of the vehicle speeds of fatal accidents at impact fall between the lower value of 43 mph and the upper value of 65 mph.
1 standard deviation v
11
Expert Solution
This question has been solved!
Explore an expertly crafted, step-by-step solution for a thorough understanding of key concepts.

This is a popular solution!

Trending now
This is a popular solution!

Step by step
Solved in 3 steps with 1 images

Recommended textbooks for you
Glencoe Algebra 1, Student Edition, 9780079039897…
Algebra
ISBN:
9780079039897
Author:
Carter
Publisher:
McGraw Hill
Glencoe Algebra 1, Student Edition, 9780079039897…
Algebra
ISBN:
9780079039897
Author:
Carter
Publisher:
McGraw Hill