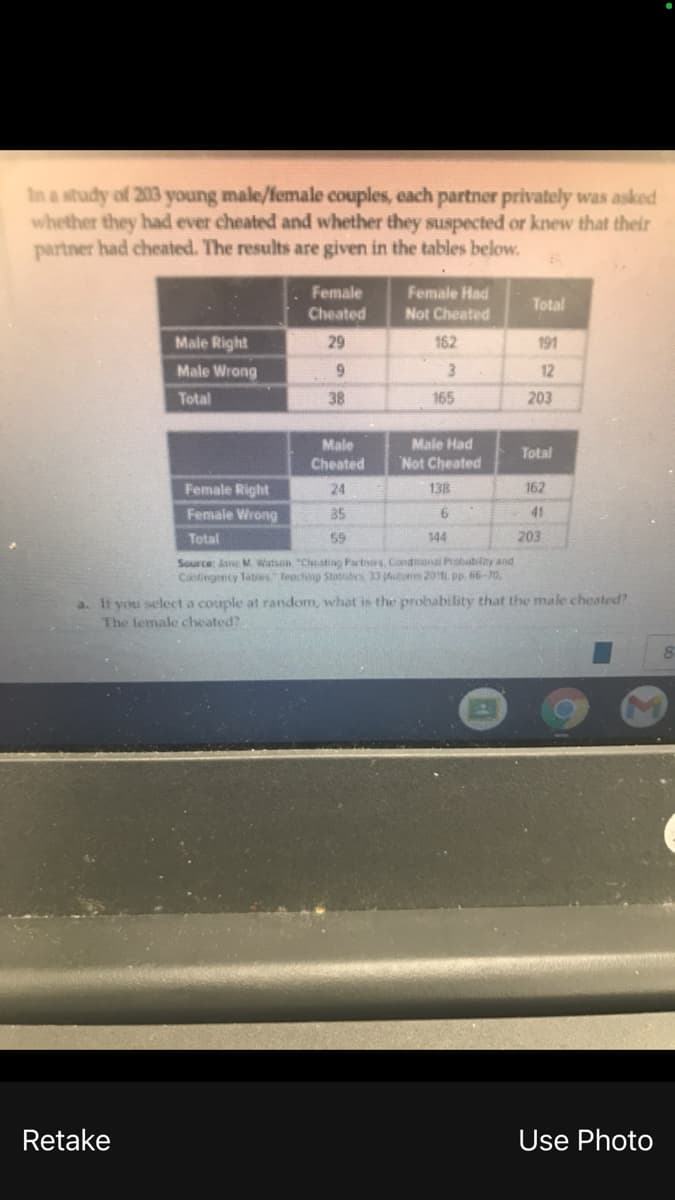
In a study of 203 young male/female couples, each partner privately was asked whether they had ever cheated and whether they suspected or knew that their partner had cheated. The results are given in the tables below. Female Female Had Not Cheated Total Cheated Male Right 29 162 191 Male Wrong 9. 3. 12 Total 38 165 203 Male Male Had Total Cheated Not Cheated Female Right 24 138 162 Female Wrong 35 41 Total 59 144 203 Source: Asne M Watson "Cheating Partnes, Conditional Probiability and Castingency Tabies Teocting Statties 33 Aut 201 pp. 66-70


Q: All changes saved . In a survey, a random selection of 2,757 adults was asked whether they…
A: In a survey, a random selection of 2,757 adults was asked whether they identified more strongly with…
Q: A health food store has launched a new pack of vitamins for children. The store records the number…
A:
Q: A panel of judges A and B graded seven debaters and independently awarded the following marks:…
A: We have given that Marks by Judge A and Judge B 40. 32 34. 39…
Q: The pass completion percentages of 10 college football quarterbacks for their freshman and sophomore…
A: Given that The pass completion percentages of 10 college football quarterbacks for their freshman…
Q: A machine is set to fill the small-size packages of M&M candies with 56 candies per bag. A sample…
A: Degrees of freedom: When estimating the statistical parameters in an experiment, the number of…
Q: A machine is set to fill the small-size packages of M&M candies with 70 candies per bag. A sample…
A: The formula of degrees of freedom is, Where, n denotes the number of observations.
Q: 6. A survey is sent out to 1,000 participants. They are each asked two questions: Do you have a…
A: We use the definitions of probability to find the probability of someone having a job as a computer…
Q: The table shows the number of wstomers Oa stone on vanious days, fraquaney customers visiting a. for…
A: Given data : Number of customers frequency 250-299 14 300-349 34 350-399 68 400-449 34…
Q: The table below lists the annual salaries (in dollars) for a sample of 12 high school math teachers…
A: Null Hypothesis: H0: The high school math teachers in Louisiana get paid is not more than those in…
Q: In a school of 100 students, 70 students play either football or cricket with 40 students that play…
A:
Q: In hypothesis testing, which of the following/s is/are true? O a. A test result might include both…
A: (A) A test result might include both type 1 and type 2 errors at the same time is the only correct…
Q: In a study of 203 young male/female couples, each partner privately was asked whether they had ever…
A: We have given that the frequency tables of male and females We will use chi square goodness of fit…
Q: itizens have different attitudes towards the DACE program. 200 US citizens were surveyed and each…
A: Let A denote the foreign born and B denote who support letting DACE recipients remain in the US…
Q: To investigate whether middle school students think that being overweight is under a child's…
A: It is been asked to summarise the given information in two way frequency table.
Q: A home pregnancy test was given to women, then pregnancy was verified through blood tests. The…
A:
Q: A survey of college students resulted in the following information: 24 own Nike shoes 28 own…
A: Since you have asked multiple questions, we will solve the first two questions for you. If you want…
Q: Pohn has 3 kinds of fruits to be compared and he made subjective judgment on which fruit he likes…
A: Given data john has 3 kinds of fruits to be compared and made subjective judgements on which one he…
Q: A random sample of 200 teenagers participated in a taste test. Each teenager sampled four choices of…
A: Total number of teen-ager participated = 200 Number of taste of fruit drinks are 4
Q: A respondent of a survey is asked whether their most recent dining experience was excellent, good,…
A: Hi! Thank you for the question, As per the honor code, we are allowed to answer one question at a…
Q: In a random sample of 1488 bachelor’s degree seeking college students, 804 earned their bachelor’s…
A: It is given that out of 1488 students, it is found that 804 earned their bachelor’s degree in 5…
Q: the statement that there is some difference in the population, denoted as Ha or HI is also known as?
A: We have given the following statement
Q: Which of the following is not a rule of inference? modus tollens modus ponens addition exportation
A:
Q: In a study of 203 young male/female couples, each partner privately was asked whether they had ever…
A: Probability of an event is the chances of occurrence of an event. The value of probability lies…
Q: The following two-way table shows the responses from a group of people, categorized by age-group…
A: The two-way table is a visual representation in the form of a table of the possible relationships…
Q: d) The School District proceeded with the study by randomly selecting students for the survey. The…
A: 2. d) A random sample of students is taken for conducting the survey and has been found that 147…
Q: A department store surveyed 428 shoppers, and the following information was obtained: 215 shoppers…
A: Given, The department store surveyed N=428 shoppers Let P denote the shoppers that made the…
Q: The following table shows the results of a survey in which the subjects were a sample of 300 adults…
A: There are two categorical variables which are level of education and attitude toward smoking in…
Q: Astudent believes that the average grade on the final examination in statistics is at least 85. She…
A:
Q: It has been reported by the professors in many Computer Science departments that the drop-out rate…
A: Population is the set of all objects of interest. Sample is s subset of the population. It is not…
Q: 1) A Research survey asked 4,615 randomly sampled registered voters their political affiliation…
A: Given information: Number of people randomly surveyed is 4615. Percentage of respondents identified…
Q: To help with marketing, the graduate division of a business school would like to advertise that more…
A: sample size, n = 55 companies
Q: n the Salsberry (2003) study shared in this weeks module, the researcher presents the following…
A: The number of categories k is 3.
Q: ential statistics, you infer from a ______ to a ______. 1. larger population; smaller sample 2.…
A: In inferential statistics, a random sample of data from the population is used to describe and make…
Q: The following are the number of defective bolts produced by two machines. Machine A Machine B 2…
A: Given: The number of defective bolts produced by two machines are, Machine A 2 4 6 5 8 10 1 3 6…
Q: Let c1, c2, and c3 be the confidence values of the rules {p}->{q}, {p}->{q, r}, and {p, r}->{q},…
A:
Q: In an investigation into the effectiveness of car seat belts, 292 accident victims were classified…
A: In order to determine whether the severity of injuries is dependent on whether the victims are…
Q: According to a recent survey of adults, approximately 62% carry cash on a regular basis. The adults…
A: If A and B are independent, then P(A|B)=P(A) or P(B|A)=P(B)
Q: A recent survey asked a group of respondents whether they are right-handed or left- handed. The…
A: Gender Right handed Left handed Total Male 43 9 52 Female 42 6 48 Total 85 15 100
Q: The general social survey asked a sample of 3151 adults how many children they had, and also how…
A: Null hypothesis: H0: Number of children and number of siblings are independent. Alternate…
Q: Which of the following are anecdotal and which are based on sample? a. Out of 200 students…
A: Please find the explanation below.
Q: The two-way table below reflects the responses from a group of middle and high school students…
A:
Q: A consumer survey was conducted to examine patterns in ownership of tablet computers, cellular…
A: Let us denote T= tablet computers C=cell phones B=Blu-ray players Given that n(T)=311, n(C)=236,…
Q: Students at a large university have four places to get lunch: the cafeteria, the hut, the taco…
A:
Q: A marketing agency conducts a random survey of 250 people living in a town. The survey finds that…
A: Solution:-
Q: 13. The following table gives the marks obtained by a batch of candidates in a certain examination…
A:
Q: Calculate and evaluate Cohen’s d and r2. What decision can you make and what does it indicate?…
A: To test that different treatments for depression leads to different results, Students'…
Q: An executive for a large company is considering a change to health insurance plans offered to the…
A: Here correct option is third option. The result may suffer from nonresponse bias because many…
Q: A total of 2604 single adults, ages 18-59, took part in an online survey Dating Monogamy 0.22 0.18…
A: We have to find given probability..
Q: 4. A department store surveyed 428 following information was obtained: 214 shoppers made a purchase,…
A:
Q: A high school track coach wanted to test whether giving the students an energy drink could affect…
A: Solution : Given : n1 = 13 n2 = 13 x¯1 = 12.7 ( mean of first group )…

Step by step
Solved in 2 steps

- The accompanying data came from a study of collusion inbidding within the construction industry (“Detection ofCollusive Behavior,” J. of Construction Engr. andMgmnt, 2012: 1251–1258).No. Bidders No. Contracts2 73 204 265 166 117 98 69 810 311 2a. What proportion of the contracts involved at mostfive bidders? At least five bidders?b. What proportion of the contracts involved betweenfive and 10 bidders, inclusive? Strictly between fiveand 10 bidders?c. Construct a histogram and comment on interestingfeatures.The health board of a major city wants to know if people who have different types of healthcare coverage (HMO, Medicare/Medicaid, or no insurance) go to different types of hospitals (privately-funded, government-funded, or free clinic) when they are injured. Using the data below, test the null hypothesis that type of insurance does not affect which hospital type they choose. Insurance Type Private Public Free Clinic HMO 17 6 4 Medicare/Medicaid 24 30 9 No insurance 8 14 8As part of a study on how people of different ages use mobile technology, each person in a sample of 258 cell phone users age 20 to 39 was asked if they use their cell phones to stay connected while they are in bed. The same question was also asked of each person in a sample of 129 cell phone users age 40 to 49. In the 20 to 39 years age group, 168 people indicated that they do stay connected while they are in bed, whilst in the 40 to 49 years old age group, 61 people stay connected while in bed.Let: ??̂ 1 = Proportion of cell phone users age 20 to 39 who stay connected while they are in bed ??̂ 2 = Proportion of cell phone users age 40 to 49 who stay connected while they are in bed ??̂= Pooled proportion of cell phone users who stay connected while they are in bed
- In a study of a group of women science majors who remained in their profession and a group who left their profession within a few months of graduation, the researchers collected the data shown here on a self-esteem questionnaire. Leavers Stayers1 = 3.05 2 = 2.92σ1 = 0.71 σ2 = 0.71n1 = 100 n2 = 227At α = 0.05, can it be concluded that there is a difference in the self-esteem scores of the two groups? Use the P-value method.The following table contains the results of a survey of daily rental rates of a mid-size car for three major rental car companies at three airport locations on three different days during the year. Is there sufficient evidence to conclude that there is a significant difference among the average daily rental rates for mid-size cars for the three rental car companies? Daily Rental Rates of Mid-Size Cars ($) New York Chicago Miami Hertz 83.9983.99 81.9981.99 73.9973.99 89.9989.99 91.9991.99 45.9945.99 77.9977.99 89.9989.99 72.9972.99 Avis 75.8675.86 77.9977.99 70.9970.99 45.1045.10 86.9986.99 60.9960.99 48.9848.98 97.9997.99 90.9990.99 National 80.0080.00 75.9975.99 57.0057.00 56.0056.00 71.0071.00 53.9953.99 56.0056.00 77.9977.99 67.9967.99 Copy Data ANOVA Source of Variation SSSS dfdf MSMS Company 709.6404709.6404 22 354.8202354.8202 Location 1631.71781631.7178 22 815.8589815.8589 Interaction 1157.83361157.8336 44 289.4584289.4584 Within…a) Persons who visit the restroom of a certain fast-food outlet were asked to state theiropinion of the quality of the restroom facilities, The following tables show the responsesfrom a sample of 100 persons. Gender of Respondent Totals Quality of Facilities Male Female Above Average 8 7 15 Average 26 24 50 Below Average 7 28 35 Totals 41 59 100 A ?2 is carried out to determine whether there is an association between the gender ofpersons and their opinion. i) State appropriate null and alternative hypotheses
- The article “Birth Order and Political Success” (Psych.Reports, 1971: 1239–1242) reports that among 31 randomlyselected candidates for political office who camefrom families with four children, 12 were firstborn, 11were middle born, and 8 were last born. Use this data totest the null hypothesis that a political candidate fromsuch a family is equally likely to be in any one of the fourordinal positionsA manager at ACME Equipment Sale and Rental wondered how offering a free two-year service warranty on its tractors might influence sales. For the next 500 customers expressing interest in purchasing a tractor, 250 were randomly offered the warranty and the rest were not. Ninety-three of those offered the warranty, and fifty-four of those not offered the warranty eventually purchased a tractor. b. Test the hypothesis that offering the warranty increases the proportion of customers who eventually purchase a tractor. Be sure to check all necessary assumptions, state the null and alternative hypotheses, obtain the p-value, and state your conclusion. Should the manager offer the warranty based on this test?The following table contains the results of a survey of daily rental rates of a mid-size car for three major rental car companies at three airport locations on three different days during the year. Is there sufficient evidence to conclude that there is a significant difference among the average daily rental rates for mid-size cars for the three rental car companies? Daily Rental Rates of Mid-Size Cars ($) New York Chicago Miami Hertz 70.9970.99 49.9949.99 47.9947.99 51.9951.99 49.9949.99 50.9950.99 47.9947.99 93.9993.99 70.9970.99 Avis 87.8687.86 47.9947.99 88.9988.99 87.1087.10 71.9971.99 80.9980.99 76.9876.98 99.9999.99 74.9974.99 National 70.0070.00 71.9971.99 58.0058.00 73.0073.00 60.0060.00 61.9961.99 66.0066.00 71.9971.99 50.9950.99 Copy Data ANOVA Source of Variation SSSS dfdf MSMS Company 1969.87811969.8781 22 984.9391984.9391 Location 123.5111123.5111 22 61.755661.7556 Interaction 472.1981472.1981 44 118.0495118.0495 Within…
- A study in Sweden looked at former elite soccer players, people who had played soccer but not at the elite level, and people of the same age who did not play soccer. Here is a two-way table that classifies these subjects by whether or not they had arthritis of the hip or knee by their mid-fifties: Elite Non-elite Did not play Arthritis 10 9 24 No arthritis 61 206 548 Based on this study, you can conclude thatPersons who visit the restroom of a certain fast-food outlet were asked to state theiropinion of the quality of the restroom facilities, The following tables show the responsesfrom a sample of 100 persons.Gender of Respondent TotalsMale FemaleQuality ofFacilitiesAbove Average 8 7 15Average 26 24 50Below Average 7 28 35Totals 41 59 100A ?2test is carried out to determine whether there is an association between the gender ofpersons and their opinion.i) State appropriate null and alternative hypotheses ii) Determine the critical region of the test at the 1% level of significance iii) Calculate the value of your test Statistic iv) What is your conclusion for this test. Give a reason for yourPersons who visit the restroom of a certain fast-food outlet were asked to state theiropinion of the quality of the restroom facilities, The following tables show the responsesfrom a sample of 100 persons.Gender of Respondent TotalsMale FemaleQuality ofFacilitiesAbove Average 8 7 15Average 26 24 50Below Average 7 28 35Totals 41 59 100A ?2test is carried out to determine whether there is an association between the gender ofpersons and their opinion.i) State appropriate null and alternative hypotheses ii) Determine the critical region of the test at the 1% level of significance iii) Calculate the value of your test Statistic iv) What is your conclusion for this test. Give a reason for your answer