In a study to test whether or not there is a difference between the average heights of adult females in two different countries, random samples of size n1 = 120 and n2 = 150 yielded x , = 62. 7 inches and x , = 61. 8 inches. Extensive studies of a similar kind have shown that it is reasonable to let ơ1 = 2. 5 inches and o1 = 2. 62 inches. Test at the 0.05 level of significance whether the difference between these two sample means is significant. 1 Instructions: Assume 8 = 0, in addressing the problem obtain the value of the test statistic and its corresponding p – value up to four decimal places. 23D — 2.8772; р — value = 0. 9979 О2 3D 2. 8772;B р— value — 0. 9980 О2%3D 2.8772; р— value = 0. 0020 Ох— 2.8772; р — value = 0.0040
In a study to test whether or not there is a difference between the average heights of adult females in two different countries, random samples of size n1 = 120 and n2 = 150 yielded x , = 62. 7 inches and x , = 61. 8 inches. Extensive studies of a similar kind have shown that it is reasonable to let ơ1 = 2. 5 inches and o1 = 2. 62 inches. Test at the 0.05 level of significance whether the difference between these two sample means is significant. 1 Instructions: Assume 8 = 0, in addressing the problem obtain the value of the test statistic and its corresponding p – value up to four decimal places. 23D — 2.8772; р — value = 0. 9979 О2 3D 2. 8772;B р— value — 0. 9980 О2%3D 2.8772; р— value = 0. 0020 Ох— 2.8772; р — value = 0.0040

Holt Mcdougal Larson Pre-algebra: Student Edition 2012
1st Edition
ISBN:9780547587776
Author:HOLT MCDOUGAL
Publisher:HOLT MCDOUGAL
Chapter11: Data Analysis And Probability
Section: Chapter Questions
Problem 8CR

Related questions
Question
100%
HELP PLS!
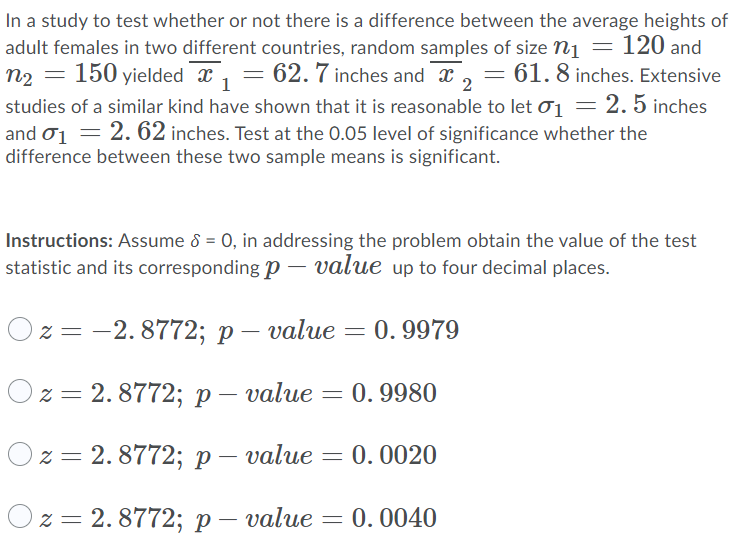
Transcribed Image Text:In a study to test whether or not there is a difference between the average heights of
adult females in two different countries, random samples of size n1 = 120 and
n2 = 150 yielded x , = 62. 7 inches and x , = 61. 8 inches. Extensive
studies of a similar kind have shown that it is reasonable to let ơ1 = 2. 5 inches
and o1 = 2. 62 inches. Test at the 0.05 level of significance whether the
difference between these two sample means is significant.
1
Instructions: Assume 8 = 0, in addressing the problem obtain the value of the test
statistic and its corresponding p – value up to four decimal places.
23D — 2.8772; р —
value = 0. 9979
О2 3D 2. 8772;B р— value — 0. 9980
О2%3D 2.8772; р— value
= 0. 0020
Ох 3D 2.8772; р —
value = 0. 0040
Expert Solution
This question has been solved!
Explore an expertly crafted, step-by-step solution for a thorough understanding of key concepts.

Step by step
Solved in 2 steps with 2 images

Recommended textbooks for you
Holt Mcdougal Larson Pre-algebra: Student Edition…
Algebra
ISBN:
9780547587776
Author:
HOLT MCDOUGAL
Publisher:
HOLT MCDOUGAL
Holt Mcdougal Larson Pre-algebra: Student Edition…
Algebra
ISBN:
9780547587776
Author:
HOLT MCDOUGAL
Publisher:
HOLT MCDOUGAL