In an August 2012 Gallup survey of 1,012 randomly selected U.S. adults (age 18 and over), 536 said that they were dissatisfied with the quality of education students receive in kindergarten through grade 12. a. Test, at the 5% significance level, if this sample provides evidence that the proportion of Americans who are dissatisfied with education in kindergarten through grade 12 differs significantly from 50%. (Be sure to state all the 5 steps involved in a hypothesis testing, Hypothesis, Observed statistic, p-value and its interpretation, decision and conclusion in context of the problem). b. Is the Test Significant. Why or Why not.
In an August 2012 Gallup survey of 1,012 randomly selected U.S. adults (age 18 and over), 536 said that they were dissatisfied with the quality of education students receive in kindergarten through grade 12. a. Test, at the 5% significance level, if this sample provides evidence that the proportion of Americans who are dissatisfied with education in kindergarten through grade 12 differs significantly from 50%. (Be sure to state all the 5 steps involved in a hypothesis testing, Hypothesis, Observed statistic, p-value and its interpretation, decision and conclusion in context of the problem). b. Is the Test Significant. Why or Why not.

Glencoe Algebra 1, Student Edition, 9780079039897, 0079039898, 2018
18th Edition
ISBN:9780079039897
Author:Carter
Publisher:Carter
Chapter10: Statistics
Section: Chapter Questions
Problem 19SGR

Related questions

Topic Video
Question
100%
In an August 2012 Gallup survey of 1,012 randomly selected U.S. adults (age 18 and over), 536 said that they were dissatisfied with the quality of education students receive in kindergarten through grade 12.
a. Test, at the 5% significance level, if this sample provides evidence that the proportion of Americans who are dissatisfied with education in kindergarten through grade 12 differs significantly from 50%.
(Be sure to state all the 5 steps involved in a hypothesis testing, Hypothesis, Observed statistic, p-value and its interpretation, decision and conclusion in context of the problem).
b. Is the Test Significant. Why or Why not.
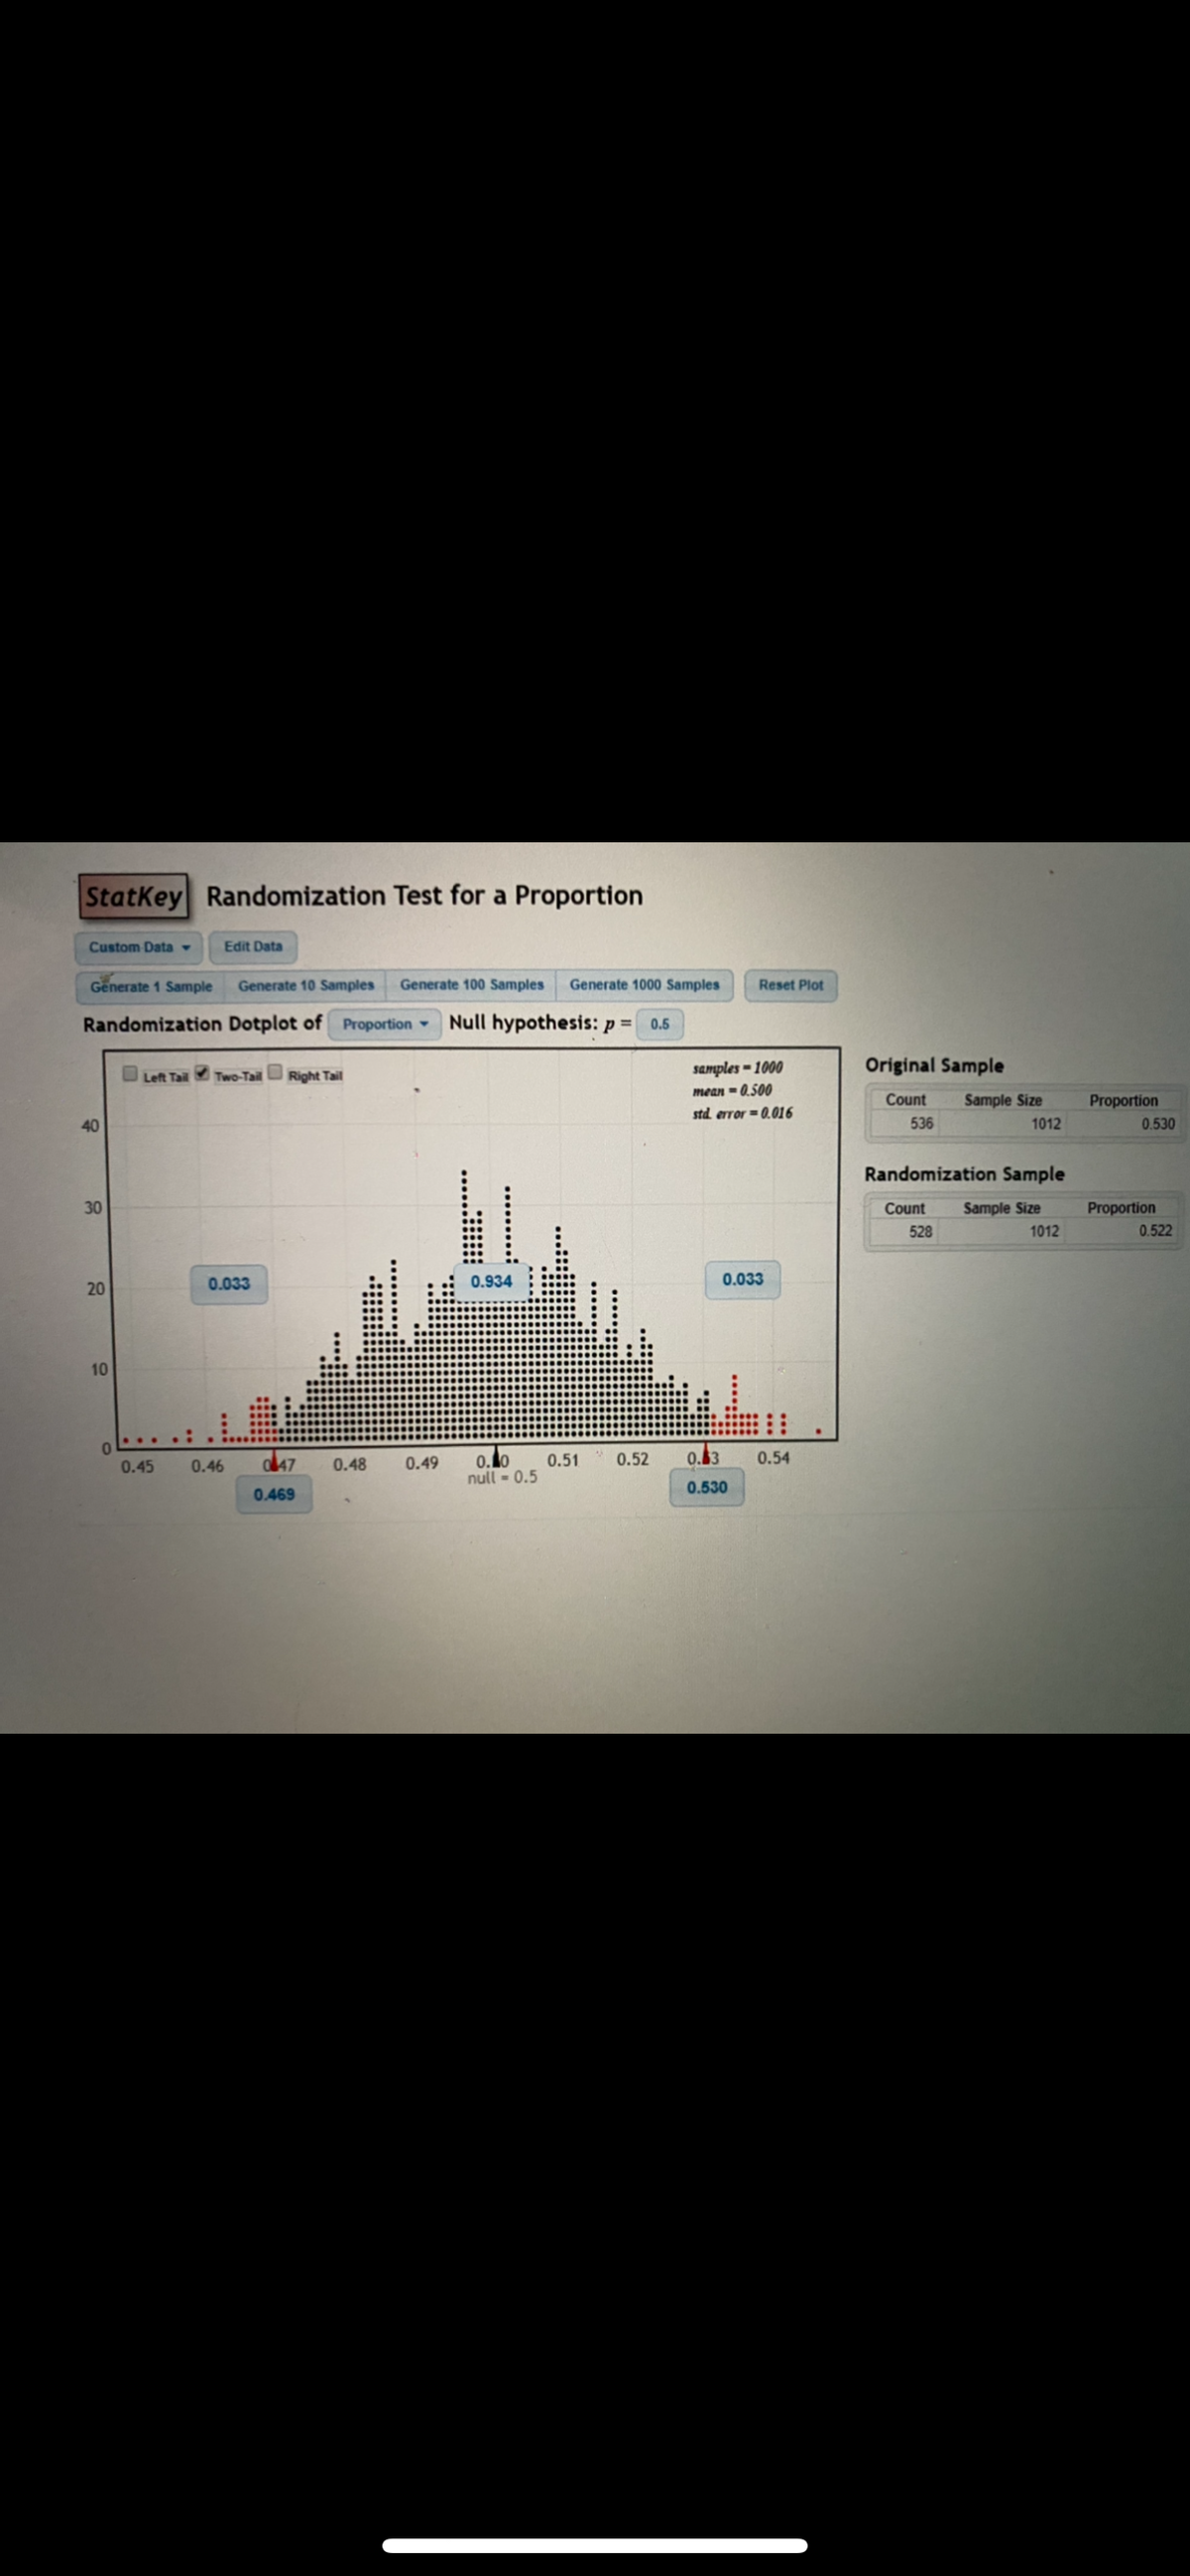
Transcribed Image Text:StatKey
Randomization Test for a Proportion
Custom Data -
Edit Data
Generate 1 Sample
Generate 10 Samples
Generate 100 Samples
Generate 1000 Samples
Reset Plot
Randomization Dotplot of Proportion Null hypothesis: p = 0.5
samples = 1000
Original Sample
Two-Tail
Right Tail
Left Tail
mean = 0.500
Count
Sample Size
Proportion
std error = 0.016
40
536
1012
0.530
Randomization Sample
30
Count
Sample Size
Proportion
528
1012
0.522
20
0.033
0.934
0.033
10
0.45
0.46
a47
0.48
0.49
0.lo
0.51
0.52
0.63
0.54
null - 0.5
0.530
0.469
Expert Solution
This question has been solved!
Explore an expertly crafted, step-by-step solution for a thorough understanding of key concepts.

This is a popular solution!

Trending now
This is a popular solution!

Step by step
Solved in 2 steps with 3 images

Knowledge Booster


Learn more about
Need a deep-dive on the concept behind this application? Look no further. Learn more about this topic, statistics and related others by exploring similar questions and additional content below.Recommended textbooks for you
Glencoe Algebra 1, Student Edition, 9780079039897…
Algebra
ISBN:
9780079039897
Author:
Carter
Publisher:
McGraw Hill

Linear Algebra: A Modern Introduction
Algebra
ISBN:
9781285463247
Author:
David Poole
Publisher:
Cengage Learning

Functions and Change: A Modeling Approach to Coll…
Algebra
ISBN:
9781337111348
Author:
Bruce Crauder, Benny Evans, Alan Noell
Publisher:
Cengage Learning
Glencoe Algebra 1, Student Edition, 9780079039897…
Algebra
ISBN:
9780079039897
Author:
Carter
Publisher:
McGraw Hill
Linear Algebra: A Modern Introduction
Algebra
ISBN:
9781285463247
Author:
David Poole
Publisher:
Cengage Learning
Functions and Change: A Modeling Approach to Coll…
Algebra
ISBN:
9781337111348
Author:
Bruce Crauder, Benny Evans, Alan Noell
Publisher:
Cengage Learning

Holt Mcdougal Larson Pre-algebra: Student Edition…
Algebra
ISBN:
9780547587776
Author:
HOLT MCDOUGAL
Publisher:
HOLT MCDOUGAL