In an experiment designed to investigate the frictional forces between bodies, a force was applied to a block of wood lying on a flat metal surface, as shown. Applied force Block of wood It was observed that a minimum force was needed to move the block. The minimum force Fmin was measured for different blocks made of the same wood but with different masses M. The results of the experiment are shown in the table. M (kg) Fmin (N) 0.52 0.58 0.64 0.75 0.88 1.01 1.21 3.1 3.6 3.9 4.4 5.2 6.2 7.4 (a) Plot a graph of Fmin against M. (b) Use a linear regression analysis to fit the best straight line through the data points.
In an experiment designed to investigate the frictional forces between bodies, a force was applied to a block of wood lying on a flat metal surface, as shown. Applied force Block of wood It was observed that a minimum force was needed to move the block. The minimum force Fmin was measured for different blocks made of the same wood but with different masses M. The results of the experiment are shown in the table. M (kg) Fmin (N) 0.52 0.58 0.64 0.75 0.88 1.01 1.21 3.1 3.6 3.9 4.4 5.2 6.2 7.4 (a) Plot a graph of Fmin against M. (b) Use a linear regression analysis to fit the best straight line through the data points.

University Physics Volume 1
18th Edition
ISBN:9781938168277
Author:William Moebs, Samuel J. Ling, Jeff Sanny
Publisher:William Moebs, Samuel J. Ling, Jeff Sanny
Chapter5: Newton's Law Of Motion
Section: Chapter Questions
Problem 21P: Two teenagers are pulling on ropes attached to a tree. The angle between the ropes is 30 . David...

Related questions

Topic Video
Question
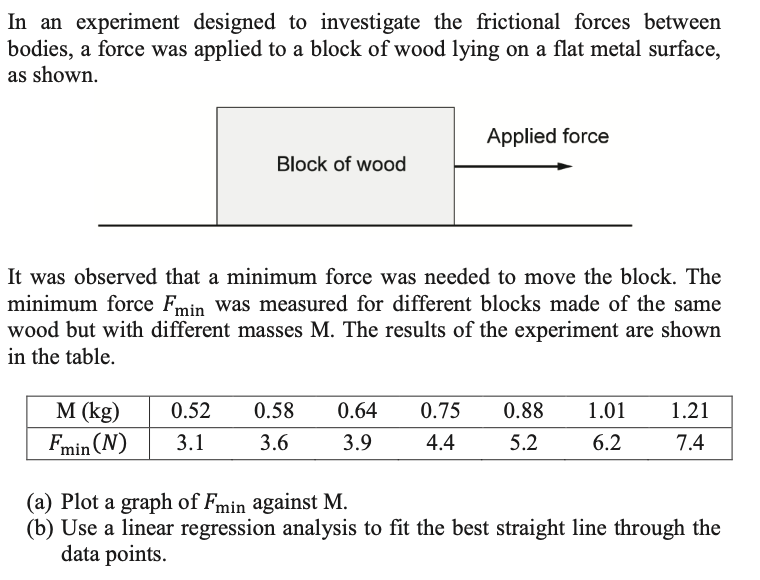
Transcribed Image Text:In an experiment designed to investigate the frictional forces between
bodies, a force was applied to a block of wood lying on a flat metal surface,
as shown.
Applied force
Block of wood
It was observed that a minimum force was needed to move the block. The
minimum force Fmin was measured for different blocks made of the same
wood but with different masses M. The results of the experiment are shown
in the table.
M (kg)
Fmin (N)
0.52
0.58
0.64
0.75
0.88
1.01
1.21
3.1
3.6
3.9
4.4
5.2
6.2
7.4
(a) Plot a graph of Fmin against M.
(b) Use a linear regression analysis to fit the best straight line through the
data points.
Expert Solution
This question has been solved!
Explore an expertly crafted, step-by-step solution for a thorough understanding of key concepts.

This is a popular solution!

Trending now
This is a popular solution!

Step by step
Solved in 2 steps with 2 images

Knowledge Booster


Learn more about
Need a deep-dive on the concept behind this application? Look no further. Learn more about this topic, physics and related others by exploring similar questions and additional content below.Recommended textbooks for you
University Physics Volume 1
Physics
ISBN:
9781938168277
Author:
William Moebs, Samuel J. Ling, Jeff Sanny
Publisher:
OpenStax - Rice University

Glencoe Physics: Principles and Problems, Student…
Physics
ISBN:
9780078807213
Author:
Paul W. Zitzewitz
Publisher:
Glencoe/McGraw-Hill
University Physics Volume 1
Physics
ISBN:
9781938168277
Author:
William Moebs, Samuel J. Ling, Jeff Sanny
Publisher:
OpenStax - Rice University
Glencoe Physics: Principles and Problems, Student…
Physics
ISBN:
9780078807213
Author:
Paul W. Zitzewitz
Publisher:
Glencoe/McGraw-Hill