In an experiment to determine whether there is a systematic difference between the weights obtained with two different scales, 10 rock specimens were weighed in grams on eac scale. The following data presented in the table were obtained. Can you conclude that the mean weight differs between the scales? Use a=0.03. Specimen Weight on Scale 1 Weight on Scale 2 di 1 11.23 11.27 -0.04 2 14.36 14.41 -0.05 8.33 8.35 -0.02 4 10.50 10.52 -0.02 5 23.42 23.41 0.01 6 9.15 9.17 -0.02 13.47 13.52 -0.05 8 6.47 6.46 0.01 9 12.40 12.45 -0.05 10 19.38 19.35 0.03 • What are the critical values? A. -1.833,1.833 B. -2.574,2.574 C. -2.398,2.398 D. -2.262,2.262 • What is the test statistic and conclusion? A. -2.204; Reject Ho
In an experiment to determine whether there is a systematic difference between the weights obtained with two different scales, 10 rock specimens were weighed in grams on eac scale. The following data presented in the table were obtained. Can you conclude that the mean weight differs between the scales? Use a=0.03. Specimen Weight on Scale 1 Weight on Scale 2 di 1 11.23 11.27 -0.04 2 14.36 14.41 -0.05 8.33 8.35 -0.02 4 10.50 10.52 -0.02 5 23.42 23.41 0.01 6 9.15 9.17 -0.02 13.47 13.52 -0.05 8 6.47 6.46 0.01 9 12.40 12.45 -0.05 10 19.38 19.35 0.03 • What are the critical values? A. -1.833,1.833 B. -2.574,2.574 C. -2.398,2.398 D. -2.262,2.262 • What is the test statistic and conclusion? A. -2.204; Reject Ho

Glencoe Algebra 1, Student Edition, 9780079039897, 0079039898, 2018
18th Edition
ISBN:9780079039897
Author:Carter
Publisher:Carter
Chapter10: Statistics
Section10.5: Comparing Sets Of Data
Problem 13PPS

Related questions
Question
Pls. answer all the given questions with solutions. will upvote if complete, thanks!
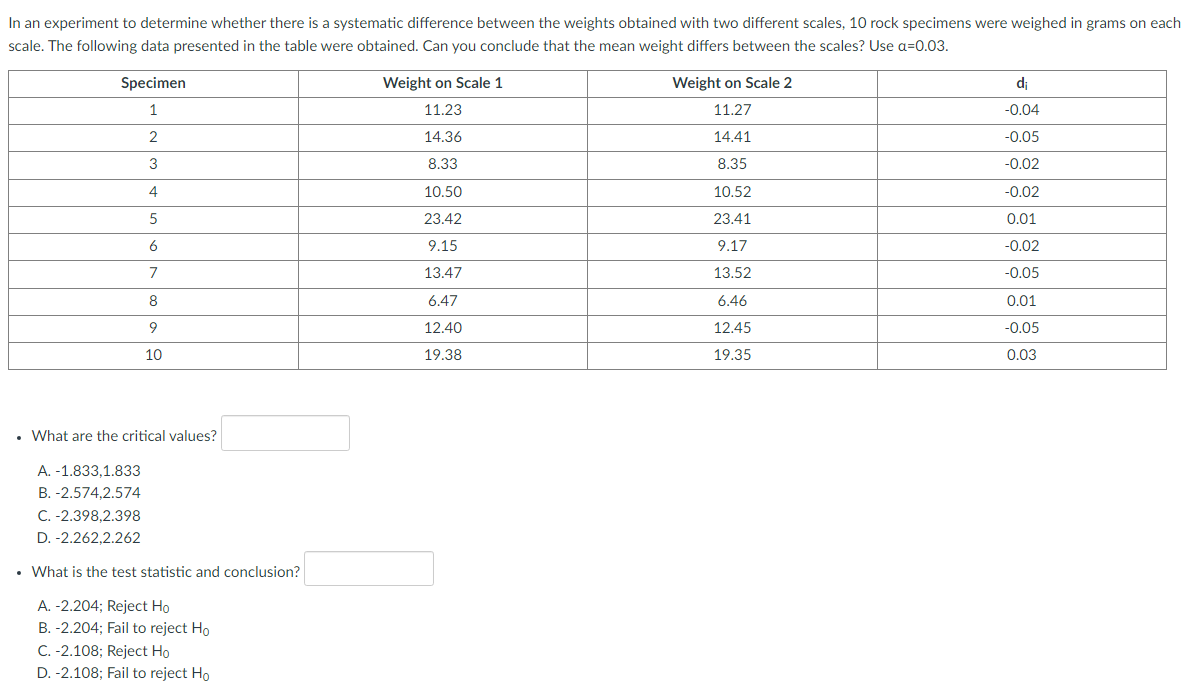
Transcribed Image Text:In an experiment to determine whether there is a systematic difference between the weights obtained with two different scales, 10 rock specimens were weighed in grams on each
scale. The following data presented in the table were obtained. Can you conclude that the mean weight differs between the scales? Use a=0.03.
Specimen
Weight on Scale 1
Weight on Scale 2
di
1
11.23
11.27
-0.04
2
14.36
14.41
-0.05
3
8.33
8.35
-0.02
4
10.50
10.52
-0.02
23.42
23.41
0.01
6
9.15
9.17
-0.02
7
13.47
13.52
-0.05
8
6.47
6.46
0.01
9
12.40
12.45
-0.05
10
19.38
19.35
0.03
• What are the critical values?
A. -1.833,1.833
B. -2.574,2.574
C. -2.398,2.398
D. -2.262.2.262
• What is the test statistic and conclusion?
A. -2.204; Reject Ho
B. -2.204; Fail to reject Ho
C. -2.108; Reject Ho
D. -2.108; Fail to reject Ho
Expert Solution
This question has been solved!
Explore an expertly crafted, step-by-step solution for a thorough understanding of key concepts.

Step by step
Solved in 2 steps

Recommended textbooks for you
Glencoe Algebra 1, Student Edition, 9780079039897…
Algebra
ISBN:
9780079039897
Author:
Carter
Publisher:
McGraw Hill
Glencoe Algebra 1, Student Edition, 9780079039897…
Algebra
ISBN:
9780079039897
Author:
Carter
Publisher:
McGraw Hill