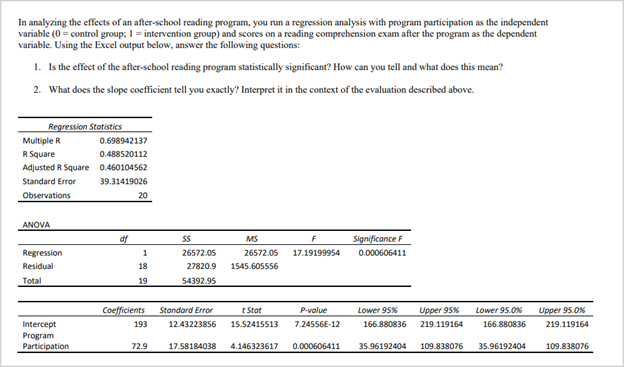
In analyzing the effects of an after-school reading program, you run a regression analysis with program participation as the independent variable (0 = control group; 1 = intervention group) and scores on a reading comprehension exam after the program as the dependent variable. Using the Excel output below, answer the following questions: 1. Is the effecet of the after-school reading program statistically significant? How can you tell and what does this mean? 2. What does the slope coefficient tell you exactly? Interpret it in the context of the evaluation described above. Regression Statistics Multiple R 0.698942137 R Square 0.488520112 Adjusted R Square 0.460104562 Standard Error 39.31419026 Observations 20 ANOVA of MS Significance F F Regression 1 26572.05 26572.05 17.19199954 0.000606411 Residual 18 27820.9 1545.605556 Total 19 54392.95 Coefficients t Stat Lower 95% Upper 95% Upper 95.0% Standard Error P-value Lower 95.0% Intercept Program Participation 193 12.43223856 15.52415513 7.24556E-12 166.880836 219.119164 166.880836 219.119164 72.9 17.58184038 4.146323617 0.000606411 35.96192404 109.838076 35.96192404 109.838076
In analyzing the effects of an after-school reading program, you run a regression analysis with program participation as the independent variable (0 = control group; 1 = intervention group) and scores on a reading comprehension exam after the program as the dependent variable. Using the Excel output below, answer the following questions: 1. Is the effecet of the after-school reading program statistically significant? How can you tell and what does this mean? 2. What does the slope coefficient tell you exactly? Interpret it in the context of the evaluation described above. Regression Statistics Multiple R 0.698942137 R Square 0.488520112 Adjusted R Square 0.460104562 Standard Error 39.31419026 Observations 20 ANOVA of MS Significance F F Regression 1 26572.05 26572.05 17.19199954 0.000606411 Residual 18 27820.9 1545.605556 Total 19 54392.95 Coefficients t Stat Lower 95% Upper 95% Upper 95.0% Standard Error P-value Lower 95.0% Intercept Program Participation 193 12.43223856 15.52415513 7.24556E-12 166.880836 219.119164 166.880836 219.119164 72.9 17.58184038 4.146323617 0.000606411 35.96192404 109.838076 35.96192404 109.838076

Functions and Change: A Modeling Approach to College Algebra (MindTap Course List)
6th Edition
ISBN:9781337111348
Author:Bruce Crauder, Benny Evans, Alan Noell
Publisher:Bruce Crauder, Benny Evans, Alan Noell
Chapter3: Straight Lines And Linear Functions
Section3.CR: Chapter Review Exercises
Problem 15CR: Life Expectancy The following table shows the average life expectancy, in years, of a child born in...

Related questions
Question
In analyzing the effects of an after-school reading program, you run a
1. Is the effect of the after-school reading program statistically significant? How can you tell, and what does this mean?
2. What is the slope (or regression coefficient) and what does it tell you exactly? Specifically, interpret it in the context of the evaluation and the program described above.
Transcribed Image Text:In analyzing the effects of an after-school reading program, you run a regression analysis with program participation as the independent
variable (0 = control group; 1 = intervention group) and scores on a reading comprehension exam after the program as the dependent
variable. Using the Excel output below, answer the following questions:
1. Is the effecet of the after-school reading program statistically significant? How can you tell and what does this mean?
2. What does the slope coefficient tell you exactly? Interpret it in the context of the evaluation described above.
Regression Statistics
Multiple R
0.698942137
R Square
0.488520112
Adjusted R Square 0.460104562
Standard Error
39.31419026
Observations
20
ANOVA
of
MS
Significance F
F
Regression
1
26572.05
26572.05
17.19199954
0.000606411
Residual
18
27820.9
1545.605556
Total
19
54392.95
Coefficients
t Stat
Upper 95%
Upper 95.0%
Standard Error
P-value
Lower 95%
Lower 95.0%
Intercept
Program
Participation
193
12.43223856
15.52415513
7.24556E-12
166.880836
219.119164
166.880836
219.119164
72.9
17.58184038
4.146323617
0.000606411
35.96192404
109.838076
35.96192404
109.838076
Expert Solution
This question has been solved!
Explore an expertly crafted, step-by-step solution for a thorough understanding of key concepts.

This is a popular solution!

Trending now
This is a popular solution!

Step by step
Solved in 2 steps

Recommended textbooks for you
Functions and Change: A Modeling Approach to Coll…
Algebra
ISBN:
9781337111348
Author:
Bruce Crauder, Benny Evans, Alan Noell
Publisher:
Cengage Learning


Glencoe Algebra 1, Student Edition, 9780079039897…
Algebra
ISBN:
9780079039897
Author:
Carter
Publisher:
McGraw Hill
Functions and Change: A Modeling Approach to Coll…
Algebra
ISBN:
9781337111348
Author:
Bruce Crauder, Benny Evans, Alan Noell
Publisher:
Cengage Learning
Glencoe Algebra 1, Student Edition, 9780079039897…
Algebra
ISBN:
9780079039897
Author:
Carter
Publisher:
McGraw Hill

Algebra and Trigonometry (MindTap Course List)
Algebra
ISBN:
9781305071742
Author:
James Stewart, Lothar Redlin, Saleem Watson
Publisher:
Cengage Learning

Big Ideas Math A Bridge To Success Algebra 1: Stu…
Algebra
ISBN:
9781680331141
Author:
HOUGHTON MIFFLIN HARCOURT
Publisher:
Houghton Mifflin Harcourt