In Country A, the population mean height for 10-year-old girls is 54.8 inches with a standard deviation of 2.2 inches. Suppose a random sample of 15 10-year-old girls from Country B is taken and that these girls had a sample mean height of 53.3 inches with a standard deviation of 2.8 inches. Assume that heights are Normally distributed. Complete parts (a) through (c) below. b. Now suppose the sample consists of 50 girls instead of 15. Repeat the test. Determine the null and alternative hypotheses. Choose the correct choice below. O B. Ho: >54.8 OC. Ho: = 54.8 O A. Ho: u= 54.8 Hiu> 54.8 O D. Ho: u= 54.8 H:u<54.8 H:u= 54.8 H: u#54.8 O E. Ho: µ#54.8 Hip= 54.8 OF. Ho: <54.8 HiH =54.8 Find the test statistic. t= (Round to two decimal places as needed.) Find the p-value. p= O(Round to three decimal places as needed.) Interpret the results of the test. Con conclude that the ta gnicantly nificance level of 5. c. Explain why the t-values and p-values for parts a and b are different. Choose the correct answer below. O A. Alarger n causes a smaller standard error (narrower sampling distribution) with less area in the tails, as shown by the larger p-value. O B. Alarger n causes a smaller standard error (narrower sampling distribution) with less area in the tails, as shown by the smaller p-value. OC. Alargern causes a larger standard error (wider sampling distribution) with more area in the tails, as shown by the larger p-value. O D. Alarger n causes a larger standard error (wider sampling distribution) with less area in the tails, as shown by the smaller p-value.
In Country A, the population mean height for 10-year-old girls is 54.8 inches with a standard deviation of 2.2 inches. Suppose a random sample of 15 10-year-old girls from Country B is taken and that these girls had a sample mean height of 53.3 inches with a standard deviation of 2.8 inches. Assume that heights are Normally distributed. Complete parts (a) through (c) below. b. Now suppose the sample consists of 50 girls instead of 15. Repeat the test. Determine the null and alternative hypotheses. Choose the correct choice below. O B. Ho: >54.8 OC. Ho: = 54.8 O A. Ho: u= 54.8 Hiu> 54.8 O D. Ho: u= 54.8 H:u<54.8 H:u= 54.8 H: u#54.8 O E. Ho: µ#54.8 Hip= 54.8 OF. Ho: <54.8 HiH =54.8 Find the test statistic. t= (Round to two decimal places as needed.) Find the p-value. p= O(Round to three decimal places as needed.) Interpret the results of the test. Con conclude that the ta gnicantly nificance level of 5. c. Explain why the t-values and p-values for parts a and b are different. Choose the correct answer below. O A. Alarger n causes a smaller standard error (narrower sampling distribution) with less area in the tails, as shown by the larger p-value. O B. Alarger n causes a smaller standard error (narrower sampling distribution) with less area in the tails, as shown by the smaller p-value. OC. Alargern causes a larger standard error (wider sampling distribution) with more area in the tails, as shown by the larger p-value. O D. Alarger n causes a larger standard error (wider sampling distribution) with less area in the tails, as shown by the smaller p-value.

Glencoe Algebra 1, Student Edition, 9780079039897, 0079039898, 2018
18th Edition
ISBN:9780079039897
Author:Carter
Publisher:Carter
Chapter10: Statistics
Section10.4: Distributions Of Data
Problem 19PFA

Related questions

Question
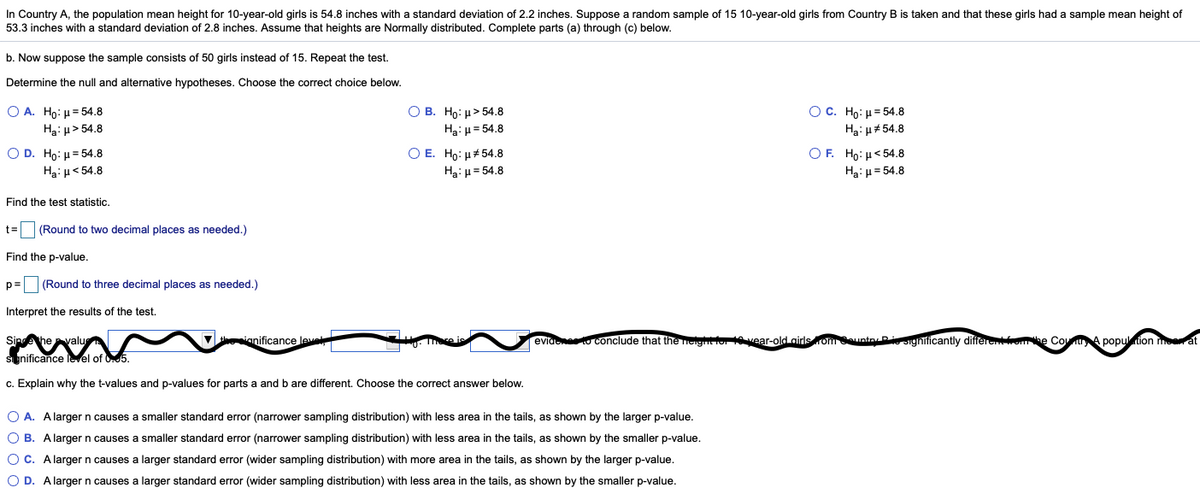
Transcribed Image Text:In Country A, the population mean height for 10-year-old girls is 54.8 inches with a standard deviation of 2.2 inches. Suppose a random sample of 15 10-year-old girls from Country B is taken and that these girls had a sample mean height of
53.3 inches with a standard deviation of 2.8 inches. Assume that heights are Normally distributed. Complete parts (a) through (c) below.
b. Now suppose the sample consists of 50 girls instead of 15. Repeat the test.
Determine the null and alternative hypotheses. Choose the correct choice below.
O A. Ho: µ = 54.8
Ha: µ> 54.8
О В. Но: и> 54.8
Hai µ= 54.8
Ос. Но: и 54.8
Ha: u#54.8
ОЕ. Но: и#54.8
Ha: µ= 54.8
O D. Ho: u = 54.8
O F. Ho: u< 54.8
Ha:H< 54.8
Ha: µ= 54.8
Find the test statistic.
t= (Round to two decimal places as needed.)
Find the p-value.
p= (Round to three decimal places as needed.)
Interpret the results of the test.
Sinahe valu
V ianificance leve
eviaeneto conclude that the neight or 1 vear-old airlsrom untay Pi sightficantly differenrom
Co A popultion me at
Significance level of 005.
c. Explain why the t-values and p-values for parts a and b are different. Choose the correct answer below.
O A. Alarger n causes a smaller standard error (narrower sampling distribution) with less area in the tails, as shown by the larger p-value.
O B. A larger n causes a smaller standard error (narrower sampling distribution) with less area in the tails, as shown by the smaller p-value.
OC. A larger n causes a larger standard error (wider sampling distribution) with more area in the tails, as shown by the larger p-value.
O D. Alarger n causes a larger standard error (wider sampling distribution) with less area in the tails, as shown by the smaller p-value.
Expert Solution
This question has been solved!
Explore an expertly crafted, step-by-step solution for a thorough understanding of key concepts.

This is a popular solution!

Trending now
This is a popular solution!

Step by step
Solved in 3 steps with 2 images

Knowledge Booster


Learn more about
Need a deep-dive on the concept behind this application? Look no further. Learn more about this topic, statistics and related others by exploring similar questions and additional content below.Recommended textbooks for you
Glencoe Algebra 1, Student Edition, 9780079039897…
Algebra
ISBN:
9780079039897
Author:
Carter
Publisher:
McGraw Hill
Glencoe Algebra 1, Student Edition, 9780079039897…
Algebra
ISBN:
9780079039897
Author:
Carter
Publisher:
McGraw Hill