In February 2021, the Chicago Tribune reported: “The overdose epidemic that has ravaged Chicago has not spared the nearby suburbs, some of which have death rates comparable to anything seen in the city, according to a report released this week by the Cook County Department of Public Health. ZIP codes in the towns of Worth, Broadview, Maywood, and Forest Park, areas that “have substantially lower median household incomes and higher poverty rates,” have been especially hard-hit, the report said.” In the article, they claimed that lower incomes were associated with higher overdose death rates and that overdose death rates are increasing over time. The data you have been analyzing wasn’t focused on Chicago, obviously. But do your results support the general gist of the statistical argument being made in this Tribune excerpt? Please address: • Do overdose death rates appear to be associated with per capita income (use scatterplot)? • Do overdose death rates appear to be increasing over time (use hypothesis test)? State 2019 Per Capita Income Overdose Death Rate (per 100,000) Alabama $ 44,145.00 16.3 Alaska $ 62,806.00 17.8 Arizona $ 46,058.00 26.8 Arkansas $ 44,629.00 13.5 California $ 66,619.00 15 Colorado $ 61,157.00 18 Connecticut $ 77,289.00 34.7 Delaware $ 54,485.00 48 Florida $ 52,426.00 25.5 Georgia $ 48,236.00 13.1 Hawaii $ 57,015.00 15.9 Idaho $ 45,968.00 15.1 Illinois $ 58,764.00 21.9 Indiana $ 48,678.00 26.6 Iowa $ 51,865.00 11.5 Kansas $ 53,426.00 14.3 Kentucky $ 43,770.00 32.5 Louisiana $ 47,460.00 28.3 Maine $ 50,634.00 29.9 Maryland $ 64,640.00 38.2 Massachusetts $ 74,187.00 32.1 Michigan $ 49,228.00 24.4 Minnesota $ 58,834.00 14.2 Mississippi $ 38,914.00 13.6 Missouri $ 48,656.00 26.9 Montana $ 49,747.00 14.1 Nebraska $ 54,515.00 8.7 Nevada $ 51,161.00 20.1 New Hampshire $ 63,502.00 32 New Jersey $ 70,471.00 31.7 New Mexico $ 43,326.00 30.2 New York $ 71,717.00 18.2 North Carolina $ 47,766.00 22.3 North Dakota $ 57,232.00 11.4 Ohio $ 50,199.00 38.3 Oklahoma $ 47,341.00 16.7 Oregon $ 53,191.00 14 Pennsylvania $ 58,032.00 35.6 Rhode Island $ 56,361.00 29.5 South Carolina $ 45,438.00 22.7 South Dakota $ 53,962.00 10.5 Tennessee $ 48,684.00 31.2 Texas $ 52,813.00 10.8 Utah $ 48,939.00 18.9 Vermont $ 55,293.00 23.8 Virginia $ 59,657.00 18.3 Washington $ 64,758.00 15.8 West Virginia $ 42,315.00 52.8 Wisconsin $ 53,227.00 21.1 Wyoming $ 62,189.00 14.1


In February 2021, the Chicago Tribune reported:
“The overdose epidemic that has ravaged Chicago has not spared the nearby suburbs, some of which have death rates comparable to anything seen in the city, according to a report released this week by the Cook County Department of Public Health. ZIP codes in the towns of Worth, Broadview, Maywood, and Forest Park, areas that “have substantially lower median household incomes and higher poverty rates,” have been especially hard-hit, the report said.”
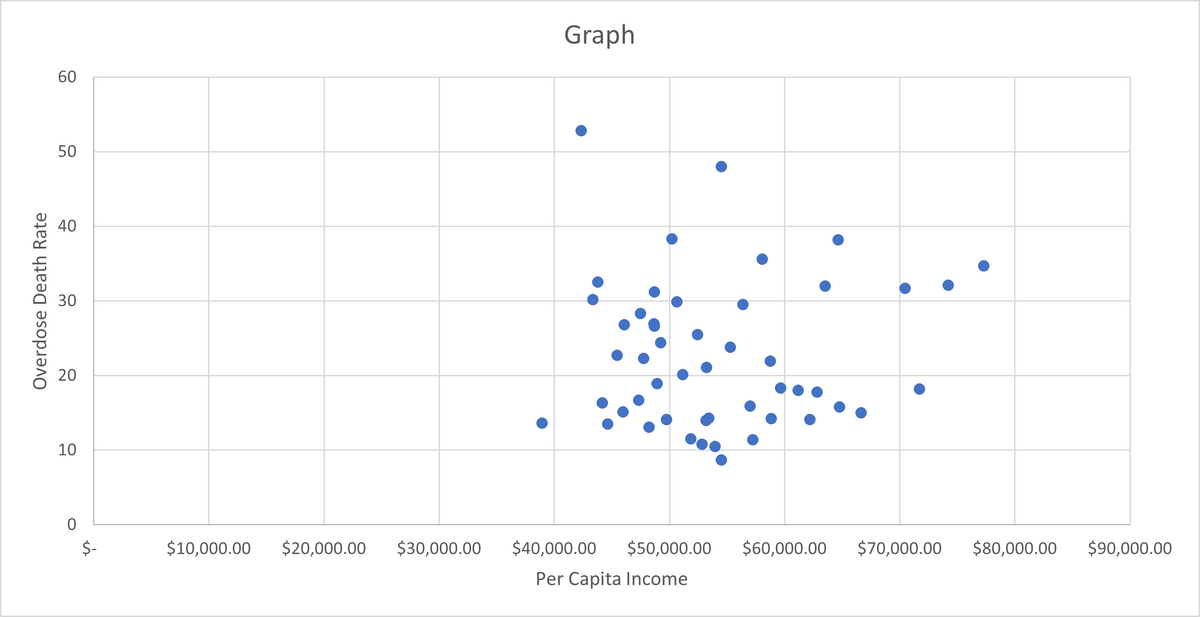
In the article, they claimed that lower incomes were associated with higher overdose death rates and that overdose death rates are increasing over time. The data you have been analyzing wasn’t focused on Chicago, obviously. But do your results support the general gist of the statistical argument being made in this Tribune excerpt? Please address:
• Do overdose death rates appear to be associated with per capita income (use scatterplot)?
• Do overdose death rates appear to be increasing over time (use hypothesis test)?
| State | 2019 | |
| Per Capita Income | Overdose Death Rate (per 100,000) | |
| Alabama | $ 44,145.00 | 16.3 |
| Alaska | $ 62,806.00 | 17.8 |
| Arizona | $ 46,058.00 | 26.8 |
| Arkansas | $ 44,629.00 | 13.5 |
| California | $ 66,619.00 | 15 |
| Colorado | $ 61,157.00 | 18 |
| Connecticut | $ 77,289.00 | 34.7 |
| Delaware | $ 54,485.00 | 48 |
| Florida | $ 52,426.00 | 25.5 |
| Georgia | $ 48,236.00 | 13.1 |
| Hawaii | $ 57,015.00 | 15.9 |
| Idaho | $ 45,968.00 | 15.1 |
| Illinois | $ 58,764.00 | 21.9 |
| Indiana | $ 48,678.00 | 26.6 |
| Iowa | $ 51,865.00 | 11.5 |
| Kansas | $ 53,426.00 | 14.3 |
| Kentucky | $ 43,770.00 | 32.5 |
| Louisiana | $ 47,460.00 | 28.3 |
| Maine | $ 50,634.00 | 29.9 |
| Maryland | $ 64,640.00 | 38.2 |
| Massachusetts | $ 74,187.00 | 32.1 |
| Michigan | $ 49,228.00 | 24.4 |
| Minnesota | $ 58,834.00 | 14.2 |
| Mississippi | $ 38,914.00 | 13.6 |
| Missouri | $ 48,656.00 | 26.9 |
| Montana | $ 49,747.00 | 14.1 |
| Nebraska | $ 54,515.00 | 8.7 |
| Nevada | $ 51,161.00 | 20.1 |
| New Hampshire | $ 63,502.00 | 32 |
| New Jersey | $ 70,471.00 | 31.7 |
| New Mexico | $ 43,326.00 | 30.2 |
| New York | $ 71,717.00 | 18.2 |
| North Carolina | $ 47,766.00 | 22.3 |
| North Dakota | $ 57,232.00 | 11.4 |
| Ohio | $ 50,199.00 | 38.3 |
| Oklahoma | $ 47,341.00 | 16.7 |
| Oregon | $ 53,191.00 | 14 |
| Pennsylvania | $ 58,032.00 | 35.6 |
| Rhode Island | $ 56,361.00 | 29.5 |
| South Carolina | $ 45,438.00 | 22.7 |
| South Dakota | $ 53,962.00 | 10.5 |
| Tennessee | $ 48,684.00 | 31.2 |
| Texas | $ 52,813.00 | 10.8 |
| Utah | $ 48,939.00 | 18.9 |
| Vermont | $ 55,293.00 | 23.8 |
| Virginia | $ 59,657.00 | 18.3 |
| Washington | $ 64,758.00 | 15.8 |
| West Virginia | $ 42,315.00 | 52.8 |
| Wisconsin | $ 53,227.00 | 21.1 |
| Wyoming | $ 62,189.00 | 14.1 |


Trending now
This is a popular solution!

Step by step
Solved in 3 steps with 2 images


