In Geogebra: use the "Statistics" tab in the Probability Calculator. Click the drop-down menu near the top (default is "Z Test of a Mean") and choose "T Test of a Mean." In Minitab: Select Stat > Basic Statistics > 1 sample t. Select Summarized Data from the drop-down menu. Check mark "Perform Hypothesis Test" and enter the hypothesized value. Click Options and select the appropriate alternate hypothesis. For both: Enter the sample mean, sample standard deviation, and sample size. We'll use a sample with x = 73.2, s = 14.16, n = 16. For a hypothesis test of Ho :µ = 70 versus HA : µ > 70: • The given sample has a test statistic of 0.91 • The P-value for the test is 0.375 For a hypothesis test of Ho : µ = 75 versus HA:µ < 75: • The given sample has a test statistic of • The P-value for the test is For a hypothesis test of Ho :µ = 75 versus HA: u # 75: • The given sample has a test statistic of • The P-value for the test is
In Geogebra: use the "Statistics" tab in the Probability Calculator. Click the drop-down menu near the top (default is "Z Test of a Mean") and choose "T Test of a Mean." In Minitab: Select Stat > Basic Statistics > 1 sample t. Select Summarized Data from the drop-down menu. Check mark "Perform Hypothesis Test" and enter the hypothesized value. Click Options and select the appropriate alternate hypothesis. For both: Enter the sample mean, sample standard deviation, and sample size. We'll use a sample with x = 73.2, s = 14.16, n = 16. For a hypothesis test of Ho :µ = 70 versus HA : µ > 70: • The given sample has a test statistic of 0.91 • The P-value for the test is 0.375 For a hypothesis test of Ho : µ = 75 versus HA:µ < 75: • The given sample has a test statistic of • The P-value for the test is For a hypothesis test of Ho :µ = 75 versus HA: u # 75: • The given sample has a test statistic of • The P-value for the test is

Glencoe Algebra 1, Student Edition, 9780079039897, 0079039898, 2018
18th Edition
ISBN:9780079039897
Author:Carter
Publisher:Carter
Chapter10: Statistics
Section10.4: Distributions Of Data
Problem 19PFA

Related questions
Question
See the picture below. My answers came back wrong. Please be certain of your answers.
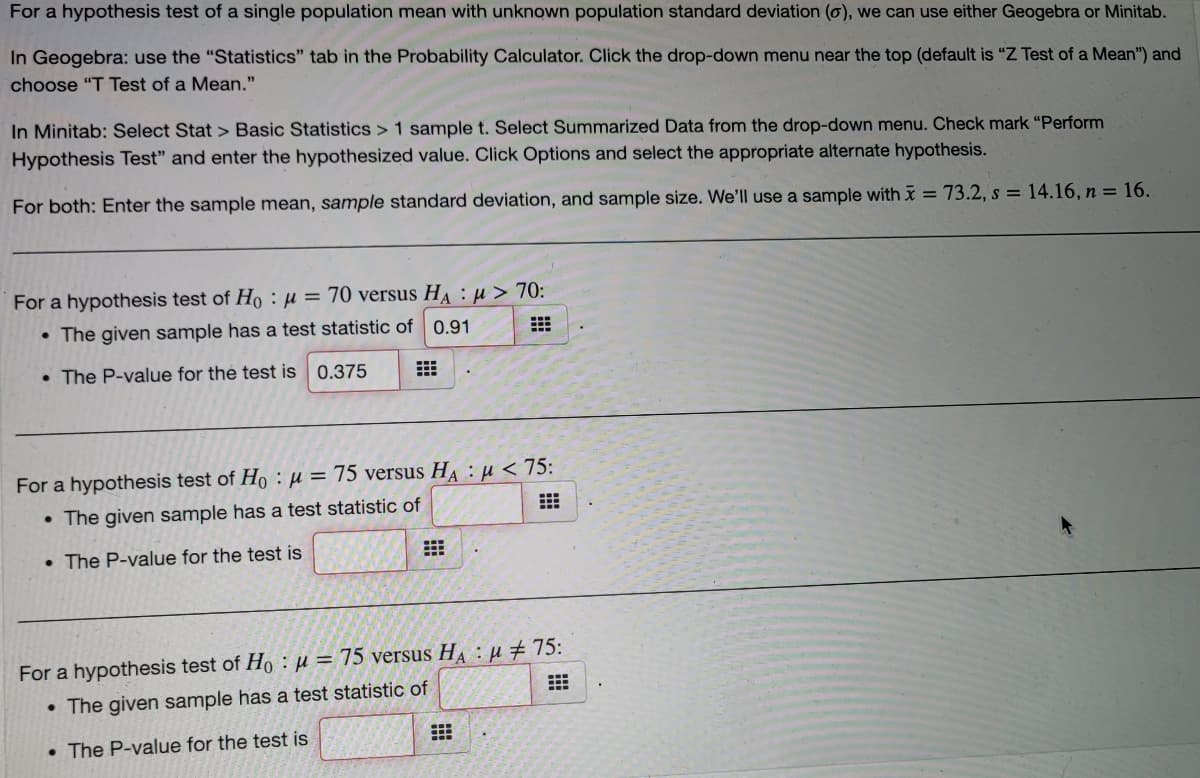
Transcribed Image Text:For a hypothesis test of a single population mean with unknown population standard deviation (o), we can use either Geogebra or Minitab.
In Geogebra: use the "Statistics" tab in the Probability Calculator. Click the drop-down menu near the top (default is "Z Test of a Mean") and
choose "T Test of a Mean."
In Minitab: Select Stat > Basic Statistics > 1 sample t. Select Summarized Data from the drop-down menu. Check mark "Perform
Hypothesis Test" and enter the hypothesized value. Click Options and select the appropriate alternate hypothesis.
For both: Enter the sample mean, sample standard deviation, and sample size. We'll use a sample with x = 73.2, s = 14.16, n = 16.
For a hypothesis test of Ho : µ = 70 versus HA : µ > 70:
• The given sample has a test statistic of 0.91
• The P-value for the test is 0.375
For a hypothesis test of Ho :µ = 75 versus HA : u < 75:
• The given sample has a test statistic of
• The P-value for the test is
For a hypothesis test of Ho :µ = 75 versus HA : u # 75:
• The given sample has a test statistic of
• The P-value for the test is
Expert Solution
This question has been solved!
Explore an expertly crafted, step-by-step solution for a thorough understanding of key concepts.

Step by step
Solved in 2 steps with 2 images

Recommended textbooks for you
Glencoe Algebra 1, Student Edition, 9780079039897…
Algebra
ISBN:
9780079039897
Author:
Carter
Publisher:
McGraw Hill

Glencoe Algebra 1, Student Edition, 9780079039897…
Algebra
ISBN:
9780079039897
Author:
Carter
Publisher:
McGraw Hill