In Millions of USD except Per Share 12 Months Ending Revenue Passenger Other Freight Revenue Growth % Other Passenger Freight FY 2014 12/31/2014 18 605,0 17 658,0 772,0 175,0 -5,20 5,60 6,70 FY 2015 12/31/2015 19 820,0 18 299,0 1 170,0 179,0 FY 2016 12/31/2016 20 425,0 18 594,0 1 660,0 171,0 FY 2017 12/31/2017 21 146,0 19 763,0 1 210,0 173,0 FY 2018 12/31/2018 21 965,0 20 455,0 1 335,0 175,0
In Millions of USD except Per Share 12 Months Ending Revenue Passenger Other Freight Revenue Growth % Other Passenger Freight FY 2014 12/31/2014 18 605,0 17 658,0 772,0 175,0 -5,20 5,60 6,70 FY 2015 12/31/2015 19 820,0 18 299,0 1 170,0 179,0 FY 2016 12/31/2016 20 425,0 18 594,0 1 660,0 171,0 FY 2017 12/31/2017 21 146,0 19 763,0 1 210,0 173,0 FY 2018 12/31/2018 21 965,0 20 455,0 1 335,0 175,0

Financial Reporting, Financial Statement Analysis and Valuation
8th Edition
ISBN:9781285190907
Author:James M. Wahlen, Stephen P. Baginski, Mark Bradshaw
Publisher:James M. Wahlen, Stephen P. Baginski, Mark Bradshaw
Chapter10: Forecasting Financial Statement
Section: Chapter Questions
Problem 4QE: Suppose you are analyzing a firm that is successfully executing a strategy that differentiates its...

Related questions
Question
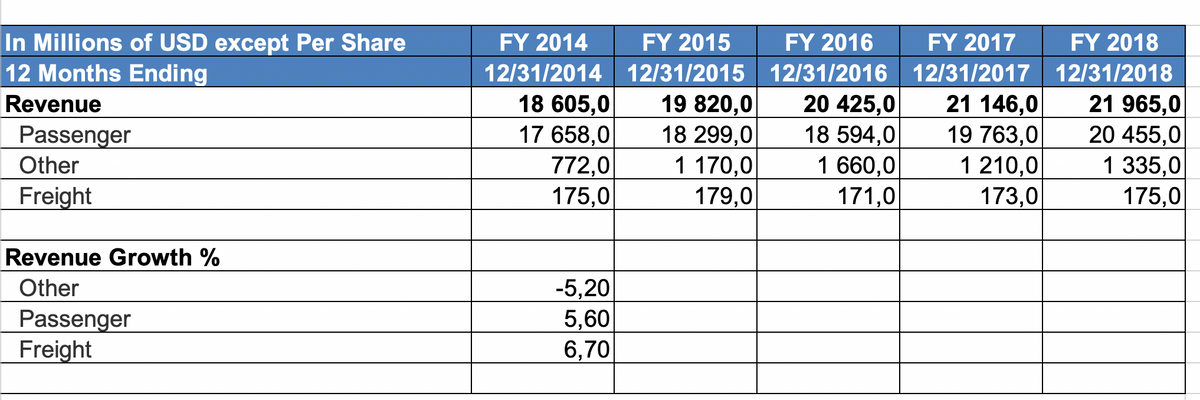
Transcribed Image Text:In Millions of USD except Per Share
12 Months Ending
Revenue
Passenger
Other
Freight
Revenue Growth %
Other
Passenger
Freight
FY 2014
12/31/2014
18 605,0
17 658,0
772,0
175,0
-5,20
5,60
6,70
FY 2015
12/31/2015
19 820,0
18 299,0
1 170,0
179,0
FY 2016
12/31/2016
20 425,0
18 594,0
1 660,0
171,0
FY 2017
12/31/2017
21 146,0
19 763,0
1 210,0
173,0
FY 2018
12/31/2018
21 965,0
20 455,0
1 335,0
175,0
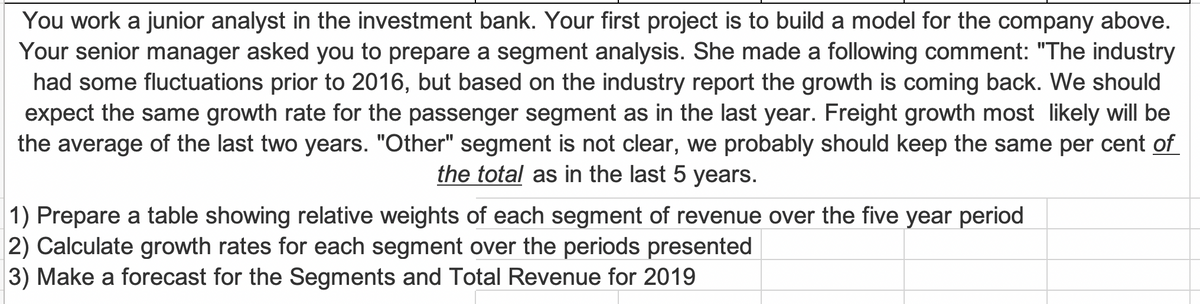
Transcribed Image Text:You work a junior analyst in the investment bank. Your first project is to build a model for the company above.
Your senior manager asked you to prepare a segment analysis. She made a following comment: "The industry
had some fluctuations prior to 2016, but based on the industry report the growth is coming back. We should
expect the same growth rate for the passenger segment as in the last year. Freight growth most likely will be
the average of the last two years. "Other" segment is not clear, we probably should keep the same per cent of
the total as in the last 5 years.
1) Prepare a table showing relative weights of each segment of revenue over the five year period
2) Calculate growth rates for each segment over the periods presented
3) Make a forecast for the Segments and Total Revenue for 2019
Expert Solution
This question has been solved!
Explore an expertly crafted, step-by-step solution for a thorough understanding of key concepts.

Step by step
Solved in 6 steps with 2 images

Knowledge Booster


Learn more about
Need a deep-dive on the concept behind this application? Look no further. Learn more about this topic, finance and related others by exploring similar questions and additional content below.Recommended textbooks for you
Financial Reporting, Financial Statement Analysis…
Finance
ISBN:
9781285190907
Author:
James M. Wahlen, Stephen P. Baginski, Mark Bradshaw
Publisher:
Cengage Learning
Financial Reporting, Financial Statement Analysis…
Finance
ISBN:
9781285190907
Author:
James M. Wahlen, Stephen P. Baginski, Mark Bradshaw
Publisher:
Cengage Learning