In one of their studies, Strayer and his students tested whether people would get better at driving while talking on a cell phone if they practiced doing so (Cooper & Strayer, 2008). They had participants drive in a simulator while talking on a hands-free cell phone and while not talking on a phone. The same people participated over several days, so they had a chance to practice this multitasking. On the first day, they were considered to be least experienced; on the last day, the most experienced. On the last day, they were tested in both a familiar environment and a slightly different driving environment to see if the first days of practice would transfer to a new context. The researchers collected data on how many collisions (accidents) the drivers got into on the simulator. All of the data is in the picture below!! Please answer the following questions about the study! 1. What kind of design is this? (put your answer in the form ___X___ 2. What are the Vs and their levels in this study? 3. What is the DV in this study and how is it being measured? 4. Create (either by computer or by hand) a line graph depicting the results shown above. 5. Estimate and describe any main effects and interactions in this study (you would need to use statistics to calculate specific effects so estimate and describe based on the data above and based on your line graph). 6. What might you conclude from the results of this study? Does experience affect cell phone use while driving?
In one of their studies, Strayer and his students tested whether people would get better at driving while talking on a cell phone if they practiced doing so (Cooper & Strayer, 2008). They had participants drive in a simulator while talking on a hands-free cell phone and while not talking on a phone. The same people participated over several days, so they had a chance to practice this multitasking. On the first day, they were considered to be least experienced; on the last day, the most experienced. On the last day, they were tested in both a familiar environment and a slightly different driving environment to see if the first days of practice would transfer to a new context. The researchers collected data on how many collisions (accidents) the drivers got into on the simulator. All of the data is in the picture below!! Please answer the following questions about the study! 1. What kind of design is this? (put your answer in the form ___X___ 2. What are the Vs and their levels in this study? 3. What is the DV in this study and how is it being measured? 4. Create (either by computer or by hand) a line graph depicting the results shown above. 5. Estimate and describe any main effects and interactions in this study (you would need to use statistics to calculate specific effects so estimate and describe based on the data above and based on your line graph). 6. What might you conclude from the results of this study? Does experience affect cell phone use while driving?

Trigonometry (MindTap Course List)
8th Edition
ISBN:9781305652224
Author:Charles P. McKeague, Mark D. Turner
Publisher:Charles P. McKeague, Mark D. Turner
Chapter8: Complex Numbers And Polarcoordinates
Section: Chapter Questions
Problem 2RP: A Bitter Dispute With the publication of Ars Magna, a dispute intensified between Jerome Cardan and...

Related questions
Question
In one of their studies, Strayer and his students
tested whether people would get better at driving
while talking on a cell phone if they practiced doing so (Cooper & Strayer, 2008). They had participants drive in a simulator while talking on a hands-free cell phone and while not talking on a phone. The same people participated over several days, so they had a chance to practice this multitasking. On the first day, they were considered to be least experienced; on the last day, the most experienced. On the last day, they were tested in both a familiar environment and a slightly different driving environment to see if the first days of practice would transfer to a new context. The researchers collected data on how many collisions (accidents) the drivers got into on the simulator. All of the data is in the picture below!!
Please answer the following questions about the study!
1. What kind of design is this? (put your answer in
the form ___X___
2. What are the Vs and their levels in this study?
3. What is the DV in this study and how is it being
measured?
4. Create (either by computer or by hand) a line graph depicting the results shown above.
5. Estimate and describe any main effects and
interactions in this study (you would need to use
statistics to calculate specific effects so
estimate and describe based on the data above
and based on your line graph).
6. What might you conclude from the results of this study? Does experience affect cell phone use while driving?
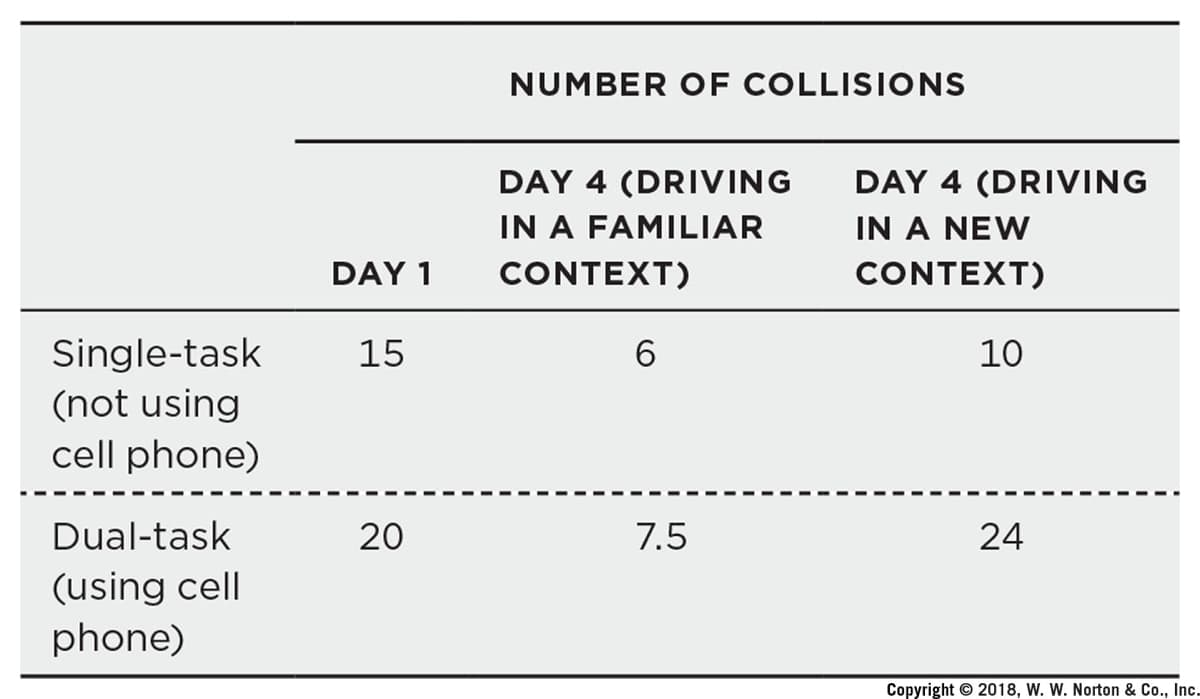
Transcribed Image Text:NUMBER OF COLLISIONS
DAY 4 (DRIVING
DAY 4 (DRIVING
IN A FAMILIAR
IN A NEW
DAY 1
CONTEXT)
CONTEXT)
Single-task
(not using
cell phone)
15
6.
10
Dual-task
20
7.5
24
(using cell
phone)
Copyright © 2018, W. W. Norton & Co., Inc.
Expert Solution
This question has been solved!
Explore an expertly crafted, step-by-step solution for a thorough understanding of key concepts.

This is a popular solution!

Trending now
This is a popular solution!

Step by step
Solved in 2 steps

Recommended textbooks for you
Trigonometry (MindTap Course List)
Trigonometry
ISBN:
9781305652224
Author:
Charles P. McKeague, Mark D. Turner
Publisher:
Cengage Learning
Trigonometry (MindTap Course List)
Trigonometry
ISBN:
9781305652224
Author:
Charles P. McKeague, Mark D. Turner
Publisher:
Cengage Learning