In order to establish a control chart for the mean of a process, 20 samples each of size 4 are collected. We note that , Ti = 4000 and , 8i = 500. The value of the lower control limit of the chart for the mean is approximately equal to 195.5. True False
In order to establish a control chart for the mean of a process, 20 samples each of size 4 are collected. We note that , Ti = 4000 and , 8i = 500. The value of the lower control limit of the chart for the mean is approximately equal to 195.5. True False

Mathematics For Machine Technology
8th Edition
ISBN:9781337798310
Author:Peterson, John.
Publisher:Peterson, John.
Chapter29: Tolerance, Clearance, And Interference
Section: Chapter Questions
Problem 16A: Spacers are manufactured to the mean dimension and tolerance shown in Figure 29-12. An inspector...

Related questions

Question
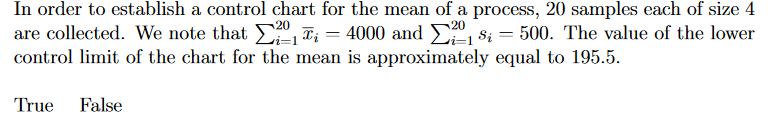
Transcribed Image Text:In order to establish a control chart for the mean of a process, 20 samples each of size 4
are collected. We note that , Ti = 4000 and , 8i = 500. The value of the lower
control limit of the chart for the mean is approximately equal to 195.5.
True
False
Expert Solution
This question has been solved!
Explore an expertly crafted, step-by-step solution for a thorough understanding of key concepts.

Step by step
Solved in 2 steps with 2 images

Knowledge Booster


Learn more about
Need a deep-dive on the concept behind this application? Look no further. Learn more about this topic, probability and related others by exploring similar questions and additional content below.Recommended textbooks for you
Mathematics For Machine Technology
Advanced Math
ISBN:
9781337798310
Author:
Peterson, John.
Publisher:
Cengage Learning,

Glencoe Algebra 1, Student Edition, 9780079039897…
Algebra
ISBN:
9780079039897
Author:
Carter
Publisher:
McGraw Hill
Mathematics For Machine Technology
Advanced Math
ISBN:
9781337798310
Author:
Peterson, John.
Publisher:
Cengage Learning,
Glencoe Algebra 1, Student Edition, 9780079039897…
Algebra
ISBN:
9780079039897
Author:
Carter
Publisher:
McGraw Hill