In order to forecast enrollment for next fall, XYZ University of the CBA wishes to forecast enrollment. The enrollment is calculated as both full-time equivalents and part-time equivalents, which represent the number of full-time students. The following is the enrollment data for the past ten years: Time(t) Enrollment ... 1 907 2 981 3 1014 4 1015 5 1050 6 1071 7 1123 8 1118 1175 10 1216 Tasks: 1. Make a scatterplot. Does the data seem to be trending linearly? 2. Calculate the Et Ey, and Ety. 3. How much does the slope mean? 4. How can the slope be interpreted? 5. What is the y-intercept of the line? 6. What does the y-intercept mean? 7. Calculate the enrollment for next year.
In order to forecast enrollment for next fall, XYZ University of the CBA wishes to forecast enrollment. The enrollment is calculated as both full-time equivalents and part-time equivalents, which represent the number of full-time students. The following is the enrollment data for the past ten years: Time(t) Enrollment ... 1 907 2 981 3 1014 4 1015 5 1050 6 1071 7 1123 8 1118 1175 10 1216 Tasks: 1. Make a scatterplot. Does the data seem to be trending linearly? 2. Calculate the Et Ey, and Ety. 3. How much does the slope mean? 4. How can the slope be interpreted? 5. What is the y-intercept of the line? 6. What does the y-intercept mean? 7. Calculate the enrollment for next year.

Glencoe Algebra 1, Student Edition, 9780079039897, 0079039898, 2018
18th Edition
ISBN:9780079039897
Author:Carter
Publisher:Carter
Chapter10: Statistics
Section10.5: Comparing Sets Of Data
Problem 13PPS

Related questions
Question
100%
Practice Pack
Answer 4 5 6 7
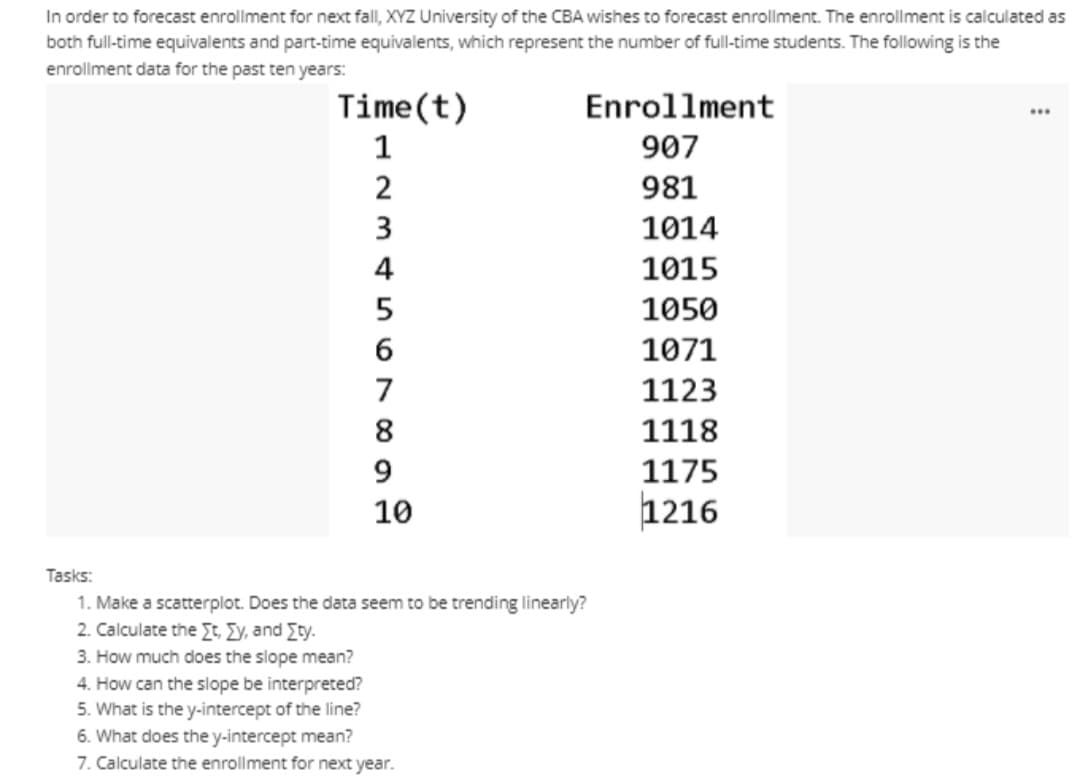
Transcribed Image Text:In order to forecast enrollment for next fall, XYZ University of the CBA wishes to forecast enrollment. The enrollment is calculated as
both full-time equivalents and part-time equivalents, which represent the number of full-time students. The following is the
enrollment data for the past ten years:
Time(t)
Enrollment
...
907
2
981
3
1014
4
1015
5
1050
6
1071
7
1123
8
1118
9.
1175
10
1216
Tasks:
1. Make a scatterplot. Does the data seem to be trending linearly?
2. Calculate the Et Ey, and Ety.
3. How much does the slope mean?
4. How can the slope be interpreted?
5. What is the y-intercept of the line?
6. What does the y-intercept mean?
7. Calculate the enrollment for next year.
Expert Solution
This question has been solved!
Explore an expertly crafted, step-by-step solution for a thorough understanding of key concepts.

Includes step-by-step video

Learn your way
Includes step-by-step video

Step by step
Solved in 2 steps with 2 images

Recommended textbooks for you
Glencoe Algebra 1, Student Edition, 9780079039897…
Algebra
ISBN:
9780079039897
Author:
Carter
Publisher:
McGraw Hill
Glencoe Algebra 1, Student Edition, 9780079039897…
Algebra
ISBN:
9780079039897
Author:
Carter
Publisher:
McGraw Hill