In order to save the cost of sampling, the experimenter has selected 10 observations from a very expensive fishes to study the random variables X, (the weight), X,(the level of Omega 3) and X,) the level of water salinity(. The data of X, X,and X, are given below, 19 |Fishes|X, X, |х, 34.00 35.00 14.00 20.00 40.00 12.00 29.00 30.00 6.00 18.00 50.00 9.00 24.00 30.00 10.00 30.00 20.00 11.00 7 1 3 14 |6 34.00 18.00 8.00 20.00 40.00 7.00 29.00 30.00|11.00 8 10 18.00 25.00 10.00 1. Discuss the above data set. 2. Develop a suitable test for the above data set. 3. Give and explain your hypotheses? 4. Discuss and interpret your results.
In order to save the cost of sampling, the experimenter has selected 10 observations from a very expensive fishes to study the random variables X, (the weight), X,(the level of Omega 3) and X,) the level of water salinity(. The data of X, X,and X, are given below, 19 |Fishes|X, X, |х, 34.00 35.00 14.00 20.00 40.00 12.00 29.00 30.00 6.00 18.00 50.00 9.00 24.00 30.00 10.00 30.00 20.00 11.00 7 1 3 14 |6 34.00 18.00 8.00 20.00 40.00 7.00 29.00 30.00|11.00 8 10 18.00 25.00 10.00 1. Discuss the above data set. 2. Develop a suitable test for the above data set. 3. Give and explain your hypotheses? 4. Discuss and interpret your results.

Holt Mcdougal Larson Pre-algebra: Student Edition 2012
1st Edition
ISBN:9780547587776
Author:HOLT MCDOUGAL
Publisher:HOLT MCDOUGAL
Chapter11: Data Analysis And Probability
Section: Chapter Questions
Problem 8CR

Related questions

Concept explainers
Equations and Inequations
Equations and inequalities describe the relationship between two mathematical expressions.
Linear Functions
A linear function can just be a constant, or it can be the constant multiplied with the variable like x or y. If the variables are of the form, x2, x1/2 or y2 it is not linear. The exponent over the variables should always be 1.
Question
Solve by SPSS
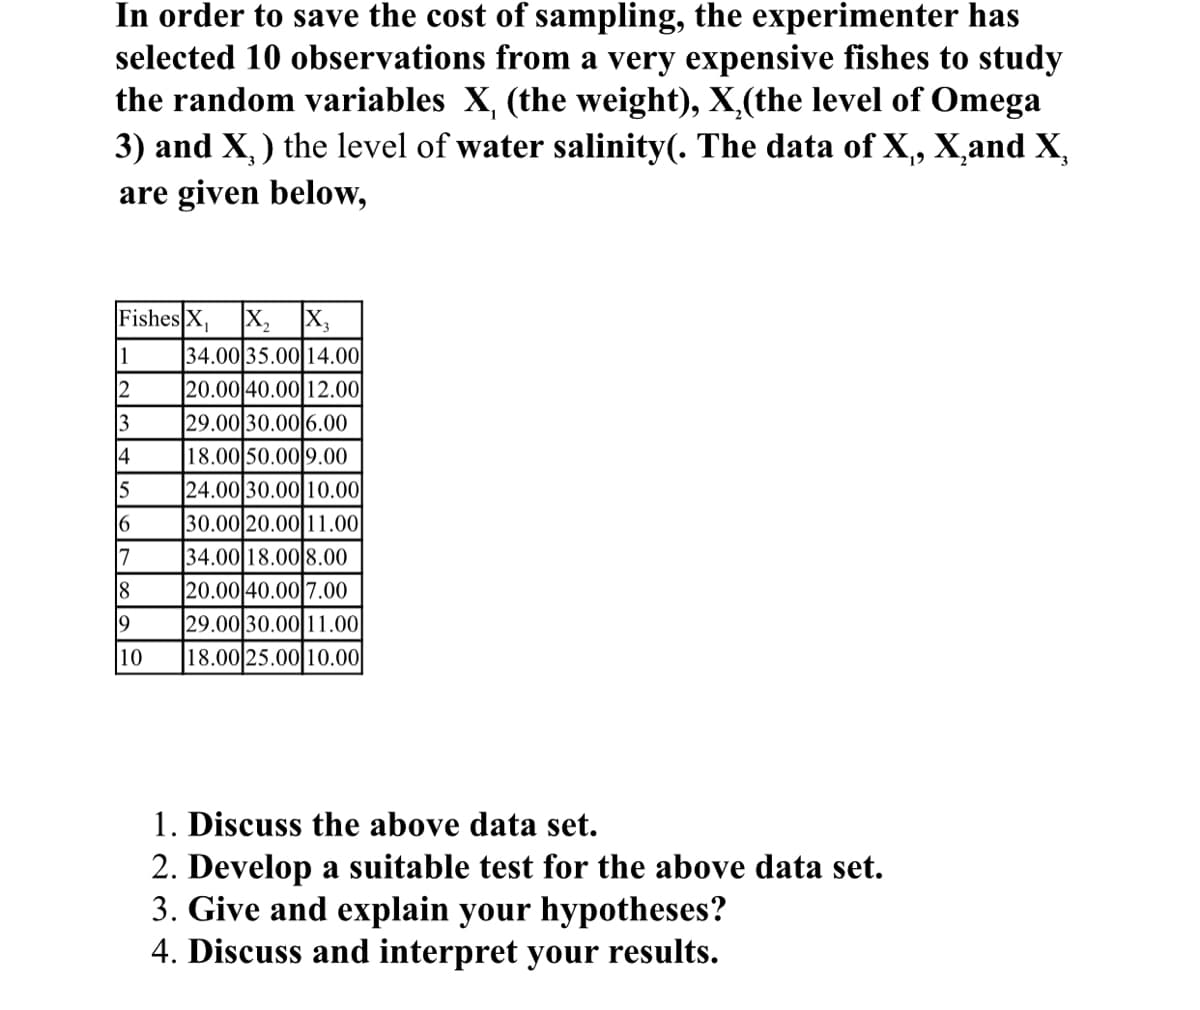
Transcribed Image Text:In order to save the cost of sampling, the experimenter has
selected 10 observations from a very expensive fishes to study
the random variables X, (the weight), X,(the level of Omega
3) and X,) the level of water salinity(. The data of X, X,and X,
are given below,
19
FishesX, X, X,
1
34.00 35.00 14.00
2
|20.00 40.00 12.00
29.00 30.00 6.00
18.00 50.00 9.00
24.00 30.00 10.00
30.00 20.00 11.00
3
14
|6
7
34.00 18.00 8.00
20.00 40.00 7.00
29.00 30.00 11.00
18.00 25.00 10.00
8
10
1. Discuss the above data set.
2. Develop a suitable test for the above data set.
3. Give and explain your hypotheses?
4. Discuss and interpret your results.
Expert Solution
This question has been solved!
Explore an expertly crafted, step-by-step solution for a thorough understanding of key concepts.

Step by step
Solved in 3 steps with 3 images

Knowledge Booster


Learn more about
Need a deep-dive on the concept behind this application? Look no further. Learn more about this topic, statistics and related others by exploring similar questions and additional content below.Recommended textbooks for you
Holt Mcdougal Larson Pre-algebra: Student Edition…
Algebra
ISBN:
9780547587776
Author:
HOLT MCDOUGAL
Publisher:
HOLT MCDOUGAL
Holt Mcdougal Larson Pre-algebra: Student Edition…
Algebra
ISBN:
9780547587776
Author:
HOLT MCDOUGAL
Publisher:
HOLT MCDOUGAL