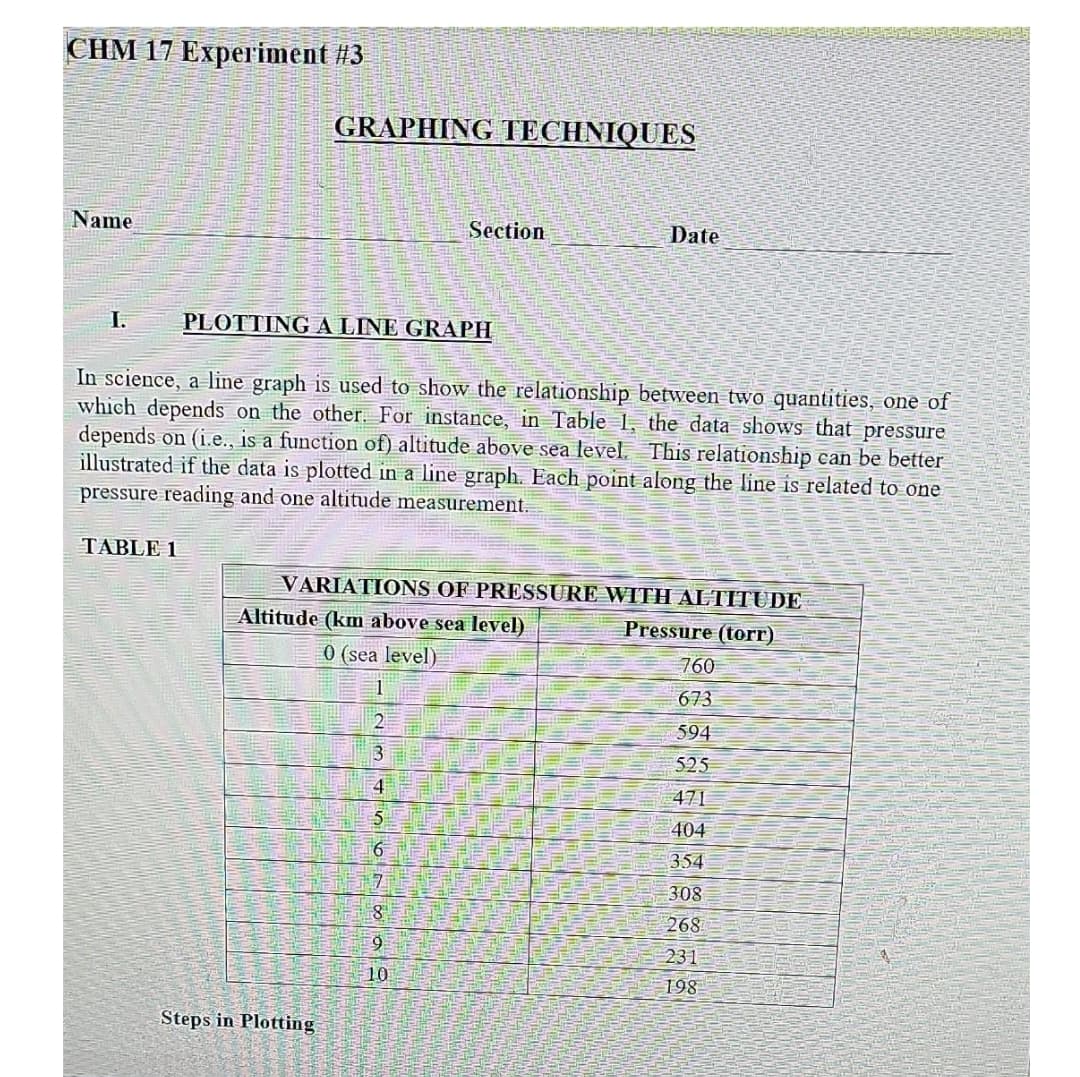
In science, a line graph is used to show the relationship between two quantities, one of which depends on the other. For instance, in Table 1, the data shows that pressure depends on (i.e., is a function of) altitude above sea level. This relationship can be better illustrated if the data is plotted in a line graph. Each point along the line is related to one pressure reading and one altitude measurement.

College Physics
1st Edition
ISBN:9781938168000
Author:Paul Peter Urone, Roger Hinrichs
Publisher:Paul Peter Urone, Roger Hinrichs
Chapter13: Temperature, Kinetic Theory, And The Gas Laws
Section: Chapter Questions
Problem 20CQ: Because humidity depends only on water's vapor pressure and temperature, are the saturation vapor...
icon
Related questions
icon
Concept explainers
Topic Video
Question

Please explain and create the graph

CHM 17 Experiment #3
Name
I.
GRAPHING TECHNIQUES
PLOTTING A LINE GRAPH
Section
Steps in Plotting
In science, a line graph is used to show the relationship between two quantities, one of
which depends on the other. For instance, in Table 1, the data shows that pressure
depends on (i.e., is a function of) altitude above sea level. This relationship can be better
illustrated if the data is plotted in a line graph. Each point along the line is related to one
pressure reading and one altitude measurement.
TABLE 1
Date
VARIATIONS OF PRESSURE WITH ALTITUDE
Altitude (km above sea level)
Pressure (torr)
0 (sea level)
1
2
3
4
5
6
7
8
9
10
760
673
594
525
471
404
354
308
268
231
198
Transcribed Image Text:CHM 17 Experiment #3 Name I. GRAPHING TECHNIQUES PLOTTING A LINE GRAPH Section Steps in Plotting In science, a line graph is used to show the relationship between two quantities, one of which depends on the other. For instance, in Table 1, the data shows that pressure depends on (i.e., is a function of) altitude above sea level. This relationship can be better illustrated if the data is plotted in a line graph. Each point along the line is related to one pressure reading and one altitude measurement. TABLE 1 Date VARIATIONS OF PRESSURE WITH ALTITUDE Altitude (km above sea level) Pressure (torr) 0 (sea level) 1 2 3 4 5 6 7 8 9 10 760 673 594 525 471 404 354 308 268 231 198
Expert Solution
steps

Step by step

Solved in 3 steps with 1 images

Blurred answer
Knowledge Booster
Fluid Pressure
Learn more about
Need a deep-dive on the concept behind this application? Look no further. Learn more about this topic, physics and related others by exploring similar questions and additional content below.
Similar questions
  • SEE MORE QUESTIONS
Recommended textbooks for you
College Physics
College Physics
Physics
ISBN:
9781938168000
Author:
Paul Peter Urone, Roger Hinrichs
Publisher:
OpenStax College
University Physics Volume 2
Physics
ISBN:
9781938168161
Author:
OpenStax
Publisher:
OpenStax
Physics for Scientists and Engineers: Foundations…
Physics
ISBN:
9781133939146
Author:
Katz, Debora M.
Publisher:
Cengage Learning