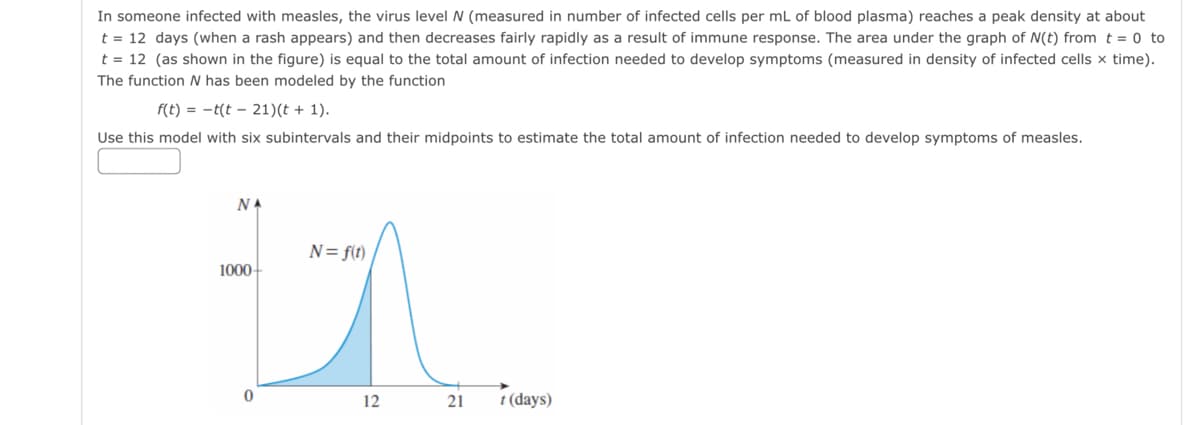
In someone infected with measles, the virus level N (measured in number of infected cells per mL of blood plasma) reaches a peak density at about t = 12 days (when a rash appears) and then decreases fairly rapidly as a result of immune response. The area under the graph of N(t) from t = 0 to t = 12 (as shown in the figure) is equal to the total amount of infection needed to develop symptoms (measured in density of infected cells x time). The function N has been modeled by the function f(t) = -t(t – 21)(t + 1). Use this model with six subintervals and their midpoints to estimate the total amount of infection needed to develop symptoms of measles. NA N= f(t) 1000- 12 21 t (days)
In someone infected with measles, the virus level N (measured in number of infected cells per mL of blood plasma) reaches a peak density at about t = 12 days (when a rash appears) and then decreases fairly rapidly as a result of immune response. The area under the graph of N(t) from t = 0 to t = 12 (as shown in the figure) is equal to the total amount of infection needed to develop symptoms (measured in density of infected cells x time). The function N has been modeled by the function f(t) = -t(t – 21)(t + 1). Use this model with six subintervals and their midpoints to estimate the total amount of infection needed to develop symptoms of measles. NA N= f(t) 1000- 12 21 t (days)

Functions and Change: A Modeling Approach to College Algebra (MindTap Course List)
6th Edition
ISBN:9781337111348
Author:Bruce Crauder, Benny Evans, Alan Noell
Publisher:Bruce Crauder, Benny Evans, Alan Noell
Chapter2: Graphical And Tabular Analysis
Section2.1: Tables And Trends
Problem 1TU: If a coffee filter is dropped, its velocity after t seconds is given by v(t)=4(10.0003t) feet per...

Related questions
Question
Transcribed Image Text:In someone infected with measles, the virus level N (measured in number of infected cells per mL of blood plasma) reaches a peak density at about
t = 12 days (when a rash appears) and then decreases fairly rapidly as a result of immune response. The area under the graph of N(t) from t = 0 to
t = 12 (as shown in the figure) is equal to the total amount of infection needed to develop symptoms (measured in density of infected cells x time).
The function N has been modeled by the function
f(t) = -t(t – 21)(t + 1).
Use this model with six subintervals and their midpoints to estimate the total amount of infection needed to develop symptoms of measles.
NA
N= f(t)
1000-
12
21
t (days)
Expert Solution
This question has been solved!
Explore an expertly crafted, step-by-step solution for a thorough understanding of key concepts.

Step by step
Solved in 2 steps with 2 images

Recommended textbooks for you
Functions and Change: A Modeling Approach to Coll…
Algebra
ISBN:
9781337111348
Author:
Bruce Crauder, Benny Evans, Alan Noell
Publisher:
Cengage Learning

Trigonometry (MindTap Course List)
Trigonometry
ISBN:
9781337278461
Author:
Ron Larson
Publisher:
Cengage Learning

Functions and Change: A Modeling Approach to Coll…
Algebra
ISBN:
9781337111348
Author:
Bruce Crauder, Benny Evans, Alan Noell
Publisher:
Cengage Learning
Trigonometry (MindTap Course List)
Trigonometry
ISBN:
9781337278461
Author:
Ron Larson
Publisher:
Cengage Learning

Algebra & Trigonometry with Analytic Geometry
Algebra
ISBN:
9781133382119
Author:
Swokowski
Publisher:
Cengage