In the backward elimination process, what happened in the first step? How many steps are in the process? Additional for it is when you perform F-test on the overall model, what will be the decision?
In the backward elimination process, what happened in the first step? How many steps are in the process? Additional for it is when you perform F-test on the overall model, what will be the decision?

Chapter6: Exponential And Logarithmic Functions
Section6.8: Fitting Exponential Models To Data
Problem 3SE: What is regression analysis? Describe the process of performing regression analysis on a graphing...

Related questions
Question
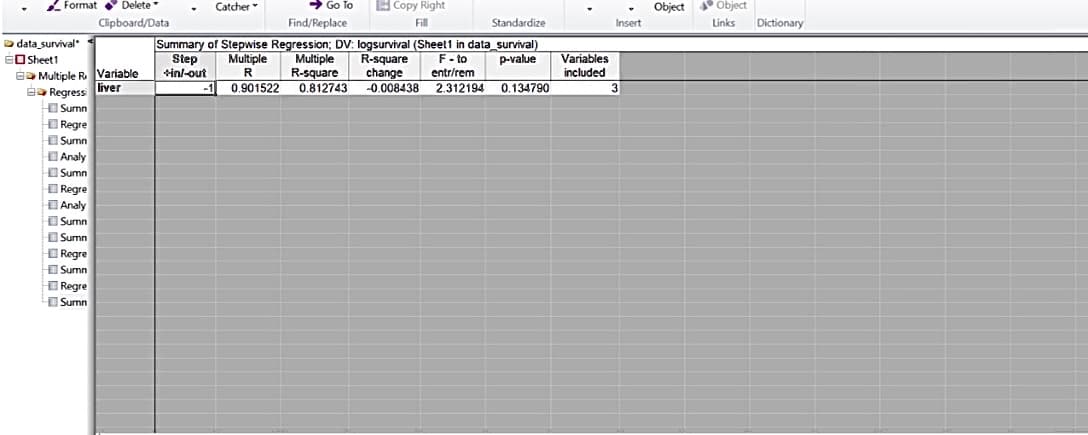
In the backward elimination process, what happened in the first step? How many steps are in the process? Additional for it is when you perform F-test on the overall model, what will be the decision?
![Statistica - [data_survival - Regression Summary for Dependent Variable: logsurvival (Sheet1 in data_survival)]
Data Mining Graphs Tools Data Workbook
View Format Statistics
ReplaceRandom Values
fo
a
DDE
OLE
Repeat
Move Screen Find
Copy Down
Copy Right
Variables Cases Variables Cases OLE
Edit
Catcher
Object
.
➜Go To
Find/Replace
Object
Links Dictionary
Clipboard/Data
Fill
Standardize
Insert
Regression Summary for Dependent Variable: logsurvival (Sheet1 in data_survival)
R= 90152235 R²= .81274255 Adjusted R²= .80150710
F(3.50) 72.337 p<.00000 Std.Error of estimate: .11822
bº
Std. Err.
b
Std. Err.
of b
of b
Multiple R
t(50)
p-value
Regress
N-54
Sumn
Intercept
Regre bloodclot
0.566020 0.114946
4.92421 0.000010
0.452009 0.064663 0.074820 0.010703 6.99023 0.000000
0.608695 0.061493 0.009556 0.000965 9.89853
0.652632 0.064536 0.007794 0.000771 10.11270
Sumn
pindex
0.000000
0.000000
Analy enzyme
Sumn
FO
Encyn
Regre
Analy
Pa
Sumn
Sumn
Regre
Sumn
Regre
Regression Summary for Dependent Variable: logsurvival (Sheet... Summary Statistics, DV: logsurvival (Sheet1 in data_survival)
Multiplo Regression Ro...
Ready
Regression Summary for Dependent Variable logsurvival (Sheet...
Shoot1 in data_survival CI,VI
28°C
8
ENG
US
Partly sunny
FSCCK=
Statistica - [data_survival - Analysis of Variance; DV: logsurvival (Sheet1 in data_survival)]
Data Mining Graphs Tools Data Workbook
Feature Finder
File
Home
Statistics
yo
Edit View Format
Cut Select All
Copy Clear.
Format Delete
Clipboard/Data
DDE
COLE
19
Variables Cases OLE
Paste
Move Screen
Replace
Repeat
Go To
Find/Replace
Random Values
Copy Down
Copy Right
Fill
Find
Variables Cases
Catcher
Object
Standardize
Insert
data surviva
Analysis of Variance; DV: logsurvival (Sheet1 in data_survival)
Sums of df
F
Sheet1
p-value
Mean
Squares
Squares
Multipl
Regr
Su
Effect
Regress.
Residual
3.032848 3 1.010949 72.33736 0.000000
0.698774 50 0.013975
Total
3.731622
Re
Su
Ar
Ar
Su
ПРО
Re
Ar
Su
Su
Re
Su
Elke
Re
Su
Su
Re
Re
Su
50
Re
ke
Ar
Ar
Regr
D
No
4
Pre
DUE
Summary Statistics, DV: logsurvival (Sheet1 in data_survival) Regression Summary for Dependent Variable: logsurvival (Sheet
Multiple Regression Ro...
Ready
Sheet1 in data survival
ACCER
File
Home
Edit
Cut
Select All
Paste
Copy Clear
Format Delete"
data survival
Sheet1
+
Feature Finder
Edit
Dictionary
Links
Analysis of Variance, DV: logsurvival (Sheet1 in data_survival)
CIVI
3.03284817921406
Object
40
D
CAP NUM REC
7:34 am
28/04/2022
-
83
4D
CAP NUM REC](/v2/_next/image?url=https%3A%2F%2Fcontent.bartleby.com%2Fqna-images%2Fquestion%2F0bff1932-31b7-4d51-b642-e3fcc7f5386a%2F28e2c620-38e1-436e-91e3-5fe0812d54a5%2Ftced6b_processed.jpeg&w=3840&q=75)
Transcribed Image Text:Statistica - [data_survival - Regression Summary for Dependent Variable: logsurvival (Sheet1 in data_survival)]
Data Mining Graphs Tools Data Workbook
View Format Statistics
ReplaceRandom Values
fo
a
DDE
OLE
Repeat
Move Screen Find
Copy Down
Copy Right
Variables Cases Variables Cases OLE
Edit
Catcher
Object
.
➜Go To
Find/Replace
Object
Links Dictionary
Clipboard/Data
Fill
Standardize
Insert
Regression Summary for Dependent Variable: logsurvival (Sheet1 in data_survival)
R= 90152235 R²= .81274255 Adjusted R²= .80150710
F(3.50) 72.337 p<.00000 Std.Error of estimate: .11822
bº
Std. Err.
b
Std. Err.
of b
of b
Multiple R
t(50)
p-value
Regress
N-54
Sumn
Intercept
Regre bloodclot
0.566020 0.114946
4.92421 0.000010
0.452009 0.064663 0.074820 0.010703 6.99023 0.000000
0.608695 0.061493 0.009556 0.000965 9.89853
0.652632 0.064536 0.007794 0.000771 10.11270
Sumn
pindex
0.000000
0.000000
Analy enzyme
Sumn
FO
Encyn
Regre
Analy
Pa
Sumn
Sumn
Regre
Sumn
Regre
Regression Summary for Dependent Variable: logsurvival (Sheet... Summary Statistics, DV: logsurvival (Sheet1 in data_survival)
Multiplo Regression Ro...
Ready
Regression Summary for Dependent Variable logsurvival (Sheet...
Shoot1 in data_survival CI,VI
28°C
8
ENG
US
Partly sunny
FSCCK=
Statistica - [data_survival - Analysis of Variance; DV: logsurvival (Sheet1 in data_survival)]
Data Mining Graphs Tools Data Workbook
Feature Finder
File
Home
Statistics
yo
Edit View Format
Cut Select All
Copy Clear.
Format Delete
Clipboard/Data
DDE
COLE
19
Variables Cases OLE
Paste
Move Screen
Replace
Repeat
Go To
Find/Replace
Random Values
Copy Down
Copy Right
Fill
Find
Variables Cases
Catcher
Object
Standardize
Insert
data surviva
Analysis of Variance; DV: logsurvival (Sheet1 in data_survival)
Sums of df
F
Sheet1
p-value
Mean
Squares
Squares
Multipl
Regr
Su
Effect
Regress.
Residual
3.032848 3 1.010949 72.33736 0.000000
0.698774 50 0.013975
Total
3.731622
Re
Su
Ar
Ar
Su
ПРО
Re
Ar
Su
Su
Re
Su
Elke
Re
Su
Su
Re
Re
Su
50
Re
ke
Ar
Ar
Regr
D
No
4
Pre
DUE
Summary Statistics, DV: logsurvival (Sheet1 in data_survival) Regression Summary for Dependent Variable: logsurvival (Sheet
Multiple Regression Ro...
Ready
Sheet1 in data survival
ACCER
File
Home
Edit
Cut
Select All
Paste
Copy Clear
Format Delete"
data survival
Sheet1
+
Feature Finder
Edit
Dictionary
Links
Analysis of Variance, DV: logsurvival (Sheet1 in data_survival)
CIVI
3.03284817921406
Object
40
D
CAP NUM REC
7:34 am
28/04/2022
-
83
4D
CAP NUM REC
Transcribed Image Text:Format Delete
data_survival
Sheet1
Catcher
Copy Right
Go To
Find/Replace
Fill
Standardize
Summary of Stepwise Regression; DV: logsurvival (Sheet1 in data_survival)
F-to p-value
Step
Multiple
R
Multiple R-square
R-square
+in/-out
change entr/rem
0.812743 -0.008438 2.312194 0.134790
0.901522
Clipboard/Data
Multiple R Variable
Regress liver
Sumn
=
Bancy
Regre
Sumn
Com
Analy
Sumn
pr
Regre
Banegie
Analy
Stian
Sumn
Sumn
Regre
Sumn
Regre
Sumn
Variables
included
Insert
3
Object
Object
Links
Dictionary
Expert Solution
This question has been solved!
Explore an expertly crafted, step-by-step solution for a thorough understanding of key concepts.

Step by step
Solved in 2 steps

Recommended textbooks for you

Big Ideas Math A Bridge To Success Algebra 1: Stu…
Algebra
ISBN:
9781680331141
Author:
HOUGHTON MIFFLIN HARCOURT
Publisher:
Houghton Mifflin Harcourt
Big Ideas Math A Bridge To Success Algebra 1: Stu…
Algebra
ISBN:
9781680331141
Author:
HOUGHTON MIFFLIN HARCOURT
Publisher:
Houghton Mifflin Harcourt