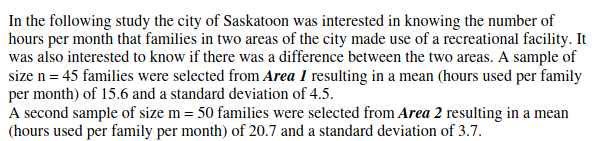
In the following study the city of Saskatoon was interested in knowing the number of hours per month that families in two areas of the city made use of a recreational facility. It was also interested to know if there was a difference between the two areas. A sample of size n = 45 families were selected from Area 1 resulting in a mean (hours used per family per month) of 15.6 and a standard deviation of 4.5. A second sample of size m = 50 families were selected from Area 2 resulting in a mean (hours used per family per month) of 20.7 and a standard deviation of 3.7.
In the following study the city of Saskatoon was interested in knowing the number of hours per month that families in two areas of the city made use of a recreational facility. It was also interested to know if there was a difference between the two areas. A sample of size n = 45 families were selected from Area 1 resulting in a mean (hours used per family per month) of 15.6 and a standard deviation of 4.5. A second sample of size m = 50 families were selected from Area 2 resulting in a mean (hours used per family per month) of 20.7 and a standard deviation of 3.7.

Glencoe Algebra 1, Student Edition, 9780079039897, 0079039898, 2018
18th Edition
ISBN:9780079039897
Author:Carter
Publisher:Carter
Chapter10: Statistics
Section10.4: Distributions Of Data
Problem 19PFA

Related questions
Topic Video
Question
Suppose that one is interested in determining if there is a difference in the mean number of hours per month that the recreational facility is used between families in Area 1 and families in Area 2.
a) Determine the appropriate test statistic and value of the test statistic?
b) If the significance level of the test is = 0.05 determine the appropriate critical region?
Transcribed Image Text:In the following study the city of Saskatoon was interested in knowing the number of
hours per month that families in two areas of the city made use of a recreational facility. It
was also interested to know if there was a difference between the two areas. A sample of
size n = 45 families were selected from Area 1 resulting in a mean (hours used per family
per month) of 15.6 and a standard deviation of 4.5.
A second sample of size m = 50 families were selected from Area 2 resulting in a mean
(hours used per family per month) of 20.7 and a standard deviation of 3.7.
Expert Solution
This question has been solved!
Explore an expertly crafted, step-by-step solution for a thorough understanding of key concepts.

This is a popular solution!

Trending now
This is a popular solution!

Step by step
Solved in 2 steps with 1 images

Knowledge Booster


Learn more about
Need a deep-dive on the concept behind this application? Look no further. Learn more about this topic, statistics and related others by exploring similar questions and additional content below.Recommended textbooks for you
Glencoe Algebra 1, Student Edition, 9780079039897…
Algebra
ISBN:
9780079039897
Author:
Carter
Publisher:
McGraw Hill
Glencoe Algebra 1, Student Edition, 9780079039897…
Algebra
ISBN:
9780079039897
Author:
Carter
Publisher:
McGraw Hill