
Calculus: Early Transcendentals
8th Edition
ISBN:9781285741550
Author:James Stewart
Publisher:James Stewart
Chapter1: Functions And Models
Section: Chapter Questions
Problem 1RCC: (a) What is a function? What are its domain and range? (b) What is the graph of a function? (c) How...

Related questions
Question
Transcribed Image Text:- File Edit View History Bookmarks Profiles
Tab
Window Help
Homework: Section 1.4
6 NWP Assessment Player UI Ap x
i education.wiley.com/was/ui/v2/assessment-player/index.html?launchld=bba0e335-3e07-493d-97c6-8f39f5c7e2c1#/question/4
omework: Section 1.4
Question 5 of 6
-/ 20
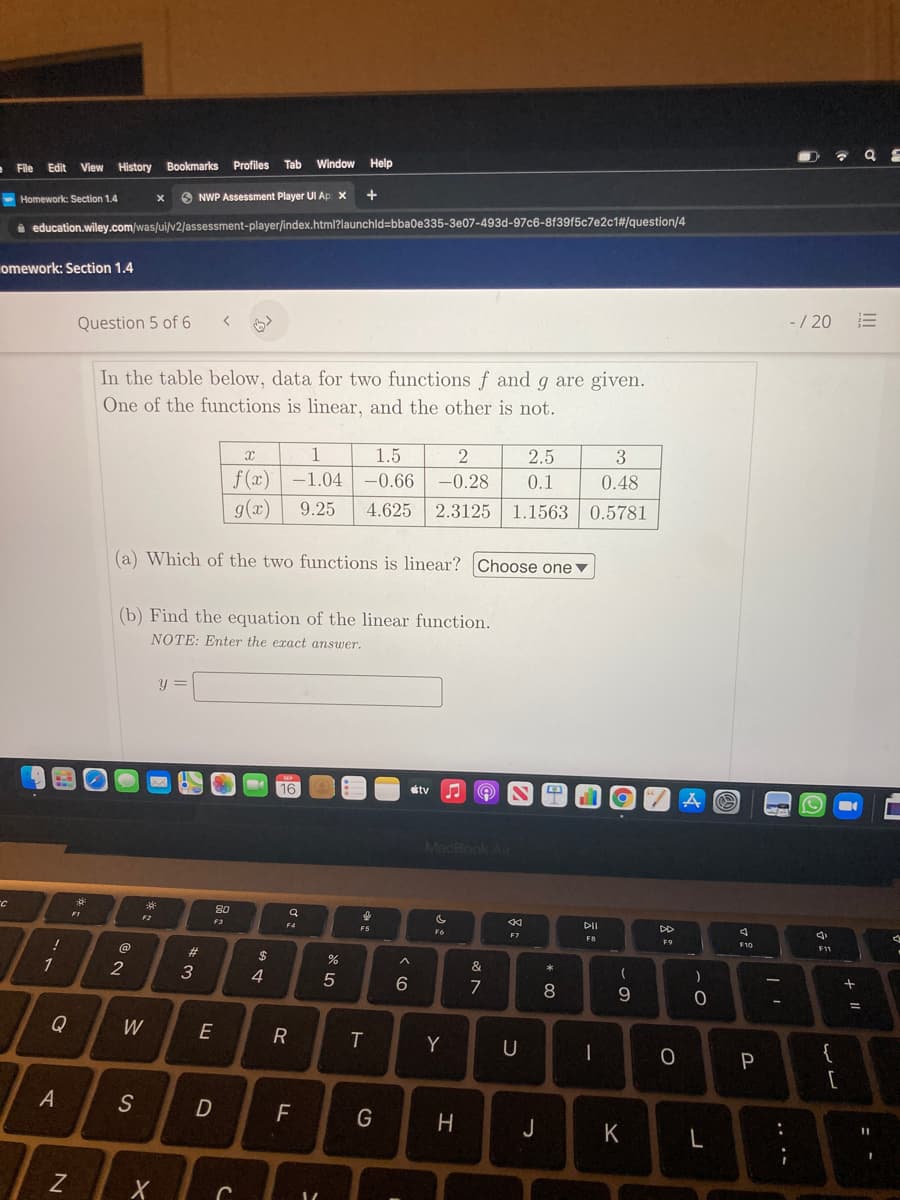
In the table below, data for two functions f and g are given.
One of the functions is linear, and the other is not.
1
1.5
2
2.5
3
f (x) -1.04
-0.66
-0.28
0.1
0.48
g(x)
9.25
4.625
2.3125
1.1563 0.5781
(a) Which of the two functions is linear? Choose one▼
(b) Find the equation of the linear function.
NOTE: Enter the exact answer.
y =
16
tv
A の
MacBook Air
80
FI
F2
F3
DII
DD
F7
F8
F9
F11
%23
2$
2
&
4
7
8
9.
%3D
Q
W
E
Y
U
{
P
[
F
G
J
K
: -
.. ..
エ
く0
D.
Expert Solution
This question has been solved!
Explore an expertly crafted, step-by-step solution for a thorough understanding of key concepts.

This is a popular solution!

Trending now
This is a popular solution!

Step by step
Solved in 2 steps with 1 images

Recommended textbooks for you
Calculus: Early Transcendentals
Calculus
ISBN:
9781285741550
Author:
James Stewart
Publisher:
Cengage Learning

Thomas' Calculus (14th Edition)
Calculus
ISBN:
9780134438986
Author:
Joel R. Hass, Christopher E. Heil, Maurice D. Weir
Publisher:
PEARSON

Calculus: Early Transcendentals (3rd Edition)
Calculus
ISBN:
9780134763644
Author:
William L. Briggs, Lyle Cochran, Bernard Gillett, Eric Schulz
Publisher:
PEARSON
Calculus: Early Transcendentals
Calculus
ISBN:
9781285741550
Author:
James Stewart
Publisher:
Cengage Learning
Thomas' Calculus (14th Edition)
Calculus
ISBN:
9780134438986
Author:
Joel R. Hass, Christopher E. Heil, Maurice D. Weir
Publisher:
PEARSON
Calculus: Early Transcendentals (3rd Edition)
Calculus
ISBN:
9780134763644
Author:
William L. Briggs, Lyle Cochran, Bernard Gillett, Eric Schulz
Publisher:
PEARSON

Calculus: Early Transcendentals
Calculus
ISBN:
9781319050740
Author:
Jon Rogawski, Colin Adams, Robert Franzosa
Publisher:
W. H. Freeman


Calculus: Early Transcendental Functions
Calculus
ISBN:
9781337552516
Author:
Ron Larson, Bruce H. Edwards
Publisher:
Cengage Learning