In the year 2020, aggregate demand and aggregate supply in the fictional country of Marjan are represented by the curves AD2020and AS on the following graph. Suppose Natural Real GDP in this economy is $6 trillion. On the following graph, use the green line (triangle symbol) to plot the long-run aggregate supply (LRAS) curve for this economy. PRICE LEVEL 107 103 102 101 100 O AD 2020 A B SRAS 2 4 6 8 REAL GDP (Trillions of dollars) 10 AD AD 6% 3% 12 B 14 Economists have forecast that if the government does nothing and the economy continues to grow at the current rate, aggregate demand in 2021 will be given by the ADA curve, resulting in the outcome illustrated by point A. If the government pursues an expansionary policy, aggregate demand in 2021 will be given by the ADB curve, resulting in the outcome illustrated by point B. LRAS The following table gives projections for the unemployment rates that would occur at point A and point B. Consider what the rate of inflation would be between 2020 and 2021, depending on whether the economy moves from the initial price level of 102 to the price level at outcome A or the price level at outcome B. Outcome C Complete the table by entering the inflation rate at each potential outcome point. Note: Calculate the inflation rate to two decimal points of precision. Unemployment Rate Inflation Rate % % Use the following graph to help you answer the questions that follow. (Note: You will not be graded for any adjustments made to this graph.)
In the year 2020, aggregate demand and aggregate supply in the fictional country of Marjan are represented by the curves AD2020and AS on the following graph. Suppose Natural Real GDP in this economy is $6 trillion. On the following graph, use the green line (triangle symbol) to plot the long-run aggregate supply (LRAS) curve for this economy. PRICE LEVEL 107 103 102 101 100 O AD 2020 A B SRAS 2 4 6 8 REAL GDP (Trillions of dollars) 10 AD AD 6% 3% 12 B 14 Economists have forecast that if the government does nothing and the economy continues to grow at the current rate, aggregate demand in 2021 will be given by the ADA curve, resulting in the outcome illustrated by point A. If the government pursues an expansionary policy, aggregate demand in 2021 will be given by the ADB curve, resulting in the outcome illustrated by point B. LRAS The following table gives projections for the unemployment rates that would occur at point A and point B. Consider what the rate of inflation would be between 2020 and 2021, depending on whether the economy moves from the initial price level of 102 to the price level at outcome A or the price level at outcome B. Outcome C Complete the table by entering the inflation rate at each potential outcome point. Note: Calculate the inflation rate to two decimal points of precision. Unemployment Rate Inflation Rate % % Use the following graph to help you answer the questions that follow. (Note: You will not be graded for any adjustments made to this graph.)

Chapter20: Aggregate Demand And Supply
Section: Chapter Questions
Problem 8SQP

Related questions
Question
Confused and not sure what's correct
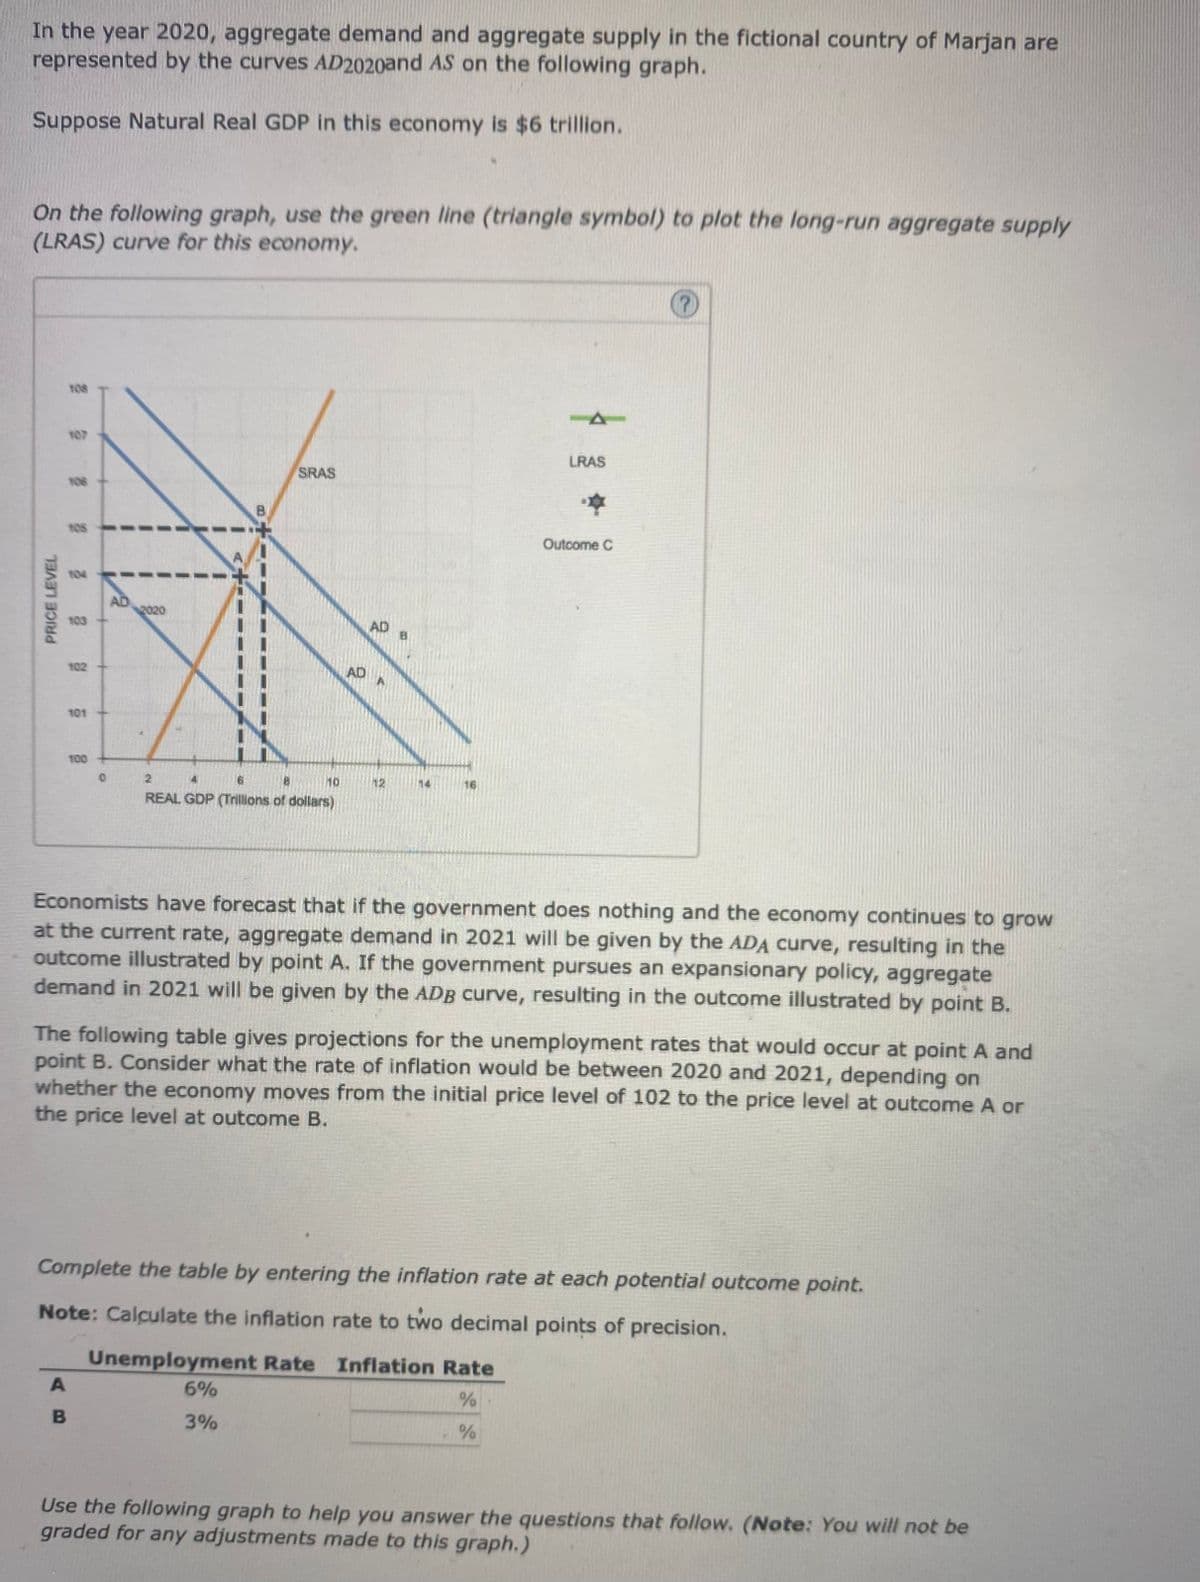
Transcribed Image Text:In the year 2020, aggregate demand and aggregate supply in the fictional country of Marjan are
represented by the curves AD2020and AS on the following graph.
Suppose Natural Real GDP in this economy is $6 trillion.
On the following graph, use the green line (triangle symbol) to plot the long-run aggregate supply
(LRAS) curve for this economy.
108
106
105
亞
PRICE LEVEL
103
102
101
100
0
A
B
I
AD
I
2020
SRAS
2
4
6
8
REAL GDP (Trillions of dollars)
10
AD
AD
12
B
14
16
-A
Economists have forecast that if the government does nothing and the economy continues to grow
at the current rate, aggregate demand in 2021 will be given by the ADA curve, resulting in the
outcome illustrated by point A. If the government pursues an expansionary policy, aggregate
demand in 2021 will be given by the ADB curve, resulting in the outcome illustrated by point B.
7
LRAS
The following table gives projections for the unemployment rates that would occur at point A and
point B. Consider what the rate of inflation would be between 2020 and 2021, depending on
whether the economy moves from the initial price level of 102 to the price level at outcome A or
the price level at outcome B.
Outcome C
Complete the table by entering the inflation rate at each potential outcome point.
Note: Calculate the inflation rate to two decimal points of precision.
Unemployment Rate Inflation Rate
6%
%
3%
%
Use the following graph to help you answer the questions that follow. (Note: You will not be
graded for any adjustments made to this graph.)
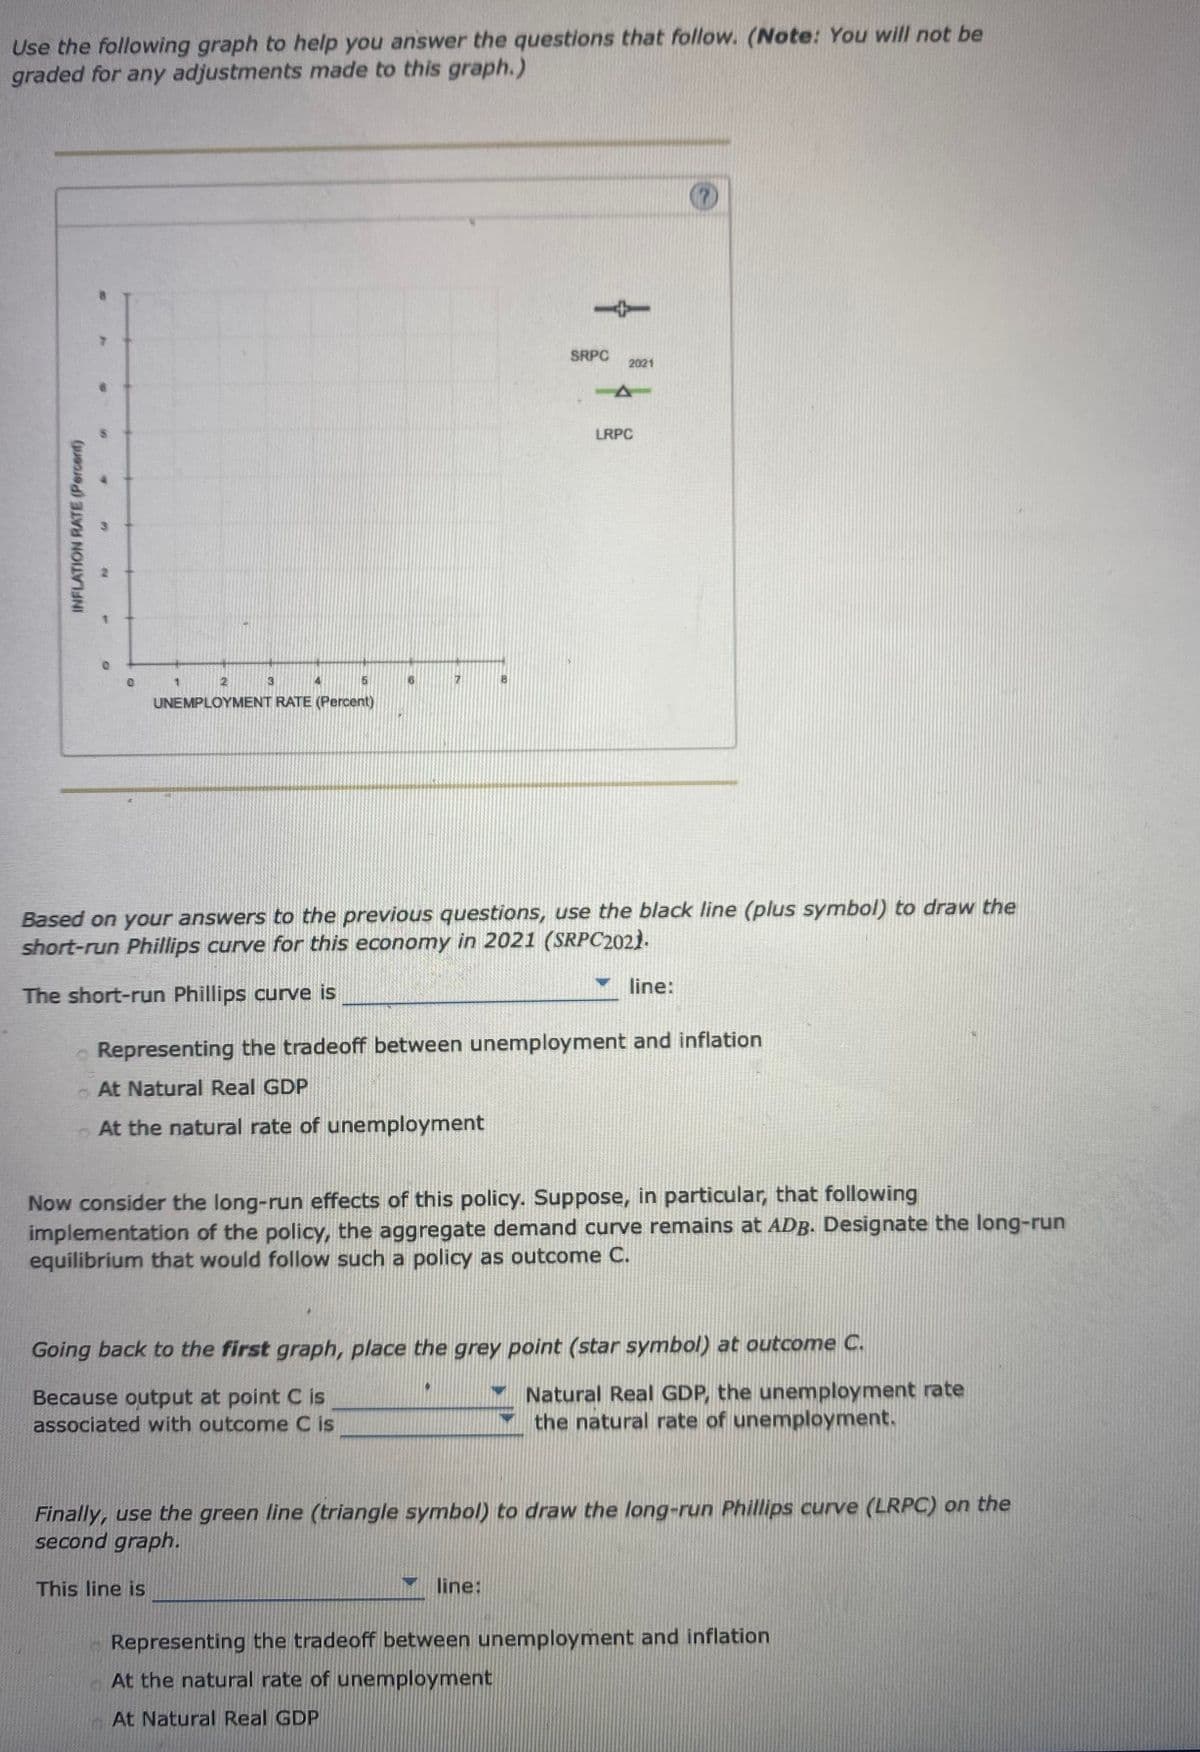
Transcribed Image Text:Use the following graph to help you answer the questions that follow. (Note: You will not be
graded for any adjustments made to this graph.)
INFLATION RATE (Percent)
O
0
2
UNEMPLOYMENT RATE (Percent)
1
B
SRPC
This line is
2021
A
Based on your answers to the previous questions, use the black line (plus symbol) to draw the
short-run Phillips curve for this economy in 2021 (SRPC202).
The short-run Phillips curve is
LRPC
line:
Representing the tradeoff between unemployment and inflation
At Natural Real GDP
At the natural rate of unemployment
line:
Now consider the long-run effects of this policy. Suppose, in particular, that following
implementation of the policy, the aggregate demand curve remains at ADB. Designate the long-run
equilibrium that would follow such a policy as outcome C.
Going back to the first graph, place the grey point (star symbol) at outcome C.
Because output at point C is
associated with outcome C is
Finally, use the green line (triangle symbol) to draw the long-run Phillips curve (LRPC) on the
second graph.
Natural Real GDP, the unemployment rate
the natural rate of unemployment.
Representing the tradeoff between unemployment and inflation
At the natural rate of unemployment
At Natural Real GDP
Expert Solution
This question has been solved!
Explore an expertly crafted, step-by-step solution for a thorough understanding of key concepts.

This is a popular solution!

Trending now
This is a popular solution!

Step by step
Solved in 2 steps with 1 images

Knowledge Booster


Learn more about
Need a deep-dive on the concept behind this application? Look no further. Learn more about this topic, economics and related others by exploring similar questions and additional content below.Recommended textbooks for you


Economics (MindTap Course List)
Economics
ISBN:
9781337617383
Author:
Roger A. Arnold
Publisher:
Cengage Learning

