In this market, the equilibrium price is s million boxes. per box, and the equilibrium quantity of oranges is For each of the prices listed in the following table, determine the quantity of oranges demanded, the quantity of oranges supplied, and the direction of pressure exerted on prices in the absence of any price controls. Price Quantity Demanded Quantity Supplied (Dollars per box) (Millions of boxes) (Millions of boxes) Pressure on Prices 15 35 True or False: A price ceiling below $25 per box is a binding price ceiling in this market. True False Because it takes many years before newly planted orange trees bear fruit, the supply curve in the short run is almost vertical. In the long run, farmers can decide whether to plant oranges on their land, to plant something else, or to sell their land altogether. Therefore, the long-run supply of oranges is much more price sensitive than the short-run supply of oranges. Assuming that the long-run demand for oranges is the same as the short-run demand, you would expect a binding price ceiling to result in a that is in the long run than in the short run.
In this market, the equilibrium price is s million boxes. per box, and the equilibrium quantity of oranges is For each of the prices listed in the following table, determine the quantity of oranges demanded, the quantity of oranges supplied, and the direction of pressure exerted on prices in the absence of any price controls. Price Quantity Demanded Quantity Supplied (Dollars per box) (Millions of boxes) (Millions of boxes) Pressure on Prices 15 35 True or False: A price ceiling below $25 per box is a binding price ceiling in this market. True False Because it takes many years before newly planted orange trees bear fruit, the supply curve in the short run is almost vertical. In the long run, farmers can decide whether to plant oranges on their land, to plant something else, or to sell their land altogether. Therefore, the long-run supply of oranges is much more price sensitive than the short-run supply of oranges. Assuming that the long-run demand for oranges is the same as the short-run demand, you would expect a binding price ceiling to result in a that is in the long run than in the short run.

Chapter1: Introducing The Economic Way Of Thinking
Section1.A: Applying Graphs To Economics
Problem 2SQP

Related questions
Question
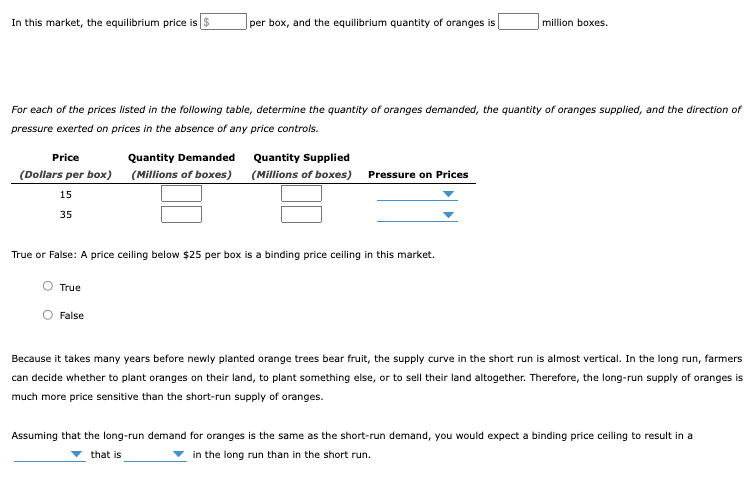
Transcribed Image Text:In this market, the equilibrium price is $
per box, and the equilibrium quantity of oranges is
million boxes.
For each of the prices listed in the following table, determine the quantity of oranges demanded, the quantity of oranges supplied, and the direction of
pressure exerted on prices in the absence of any price controls.
Price
Quantity Demanded Quantity Supplied
(Dollars per box) (Millions of boxes) (Millions of boxes) Pressure on Prices
15
35
True or False: A price ceiling below $25 per box is a binding price ceiling in this market.
True
False
Because it takes many years before newly planted orange trees bear fruit, the supply curve in the short run is almost vertical. In the long run, farmers
can decide whether to plant oranges on their land, to plant something else, or to sell their land altogether. Therefore, the long-run supply of oranges is
much more price sensitive than the short-run supply of oranges.
Assuming that the long-run demand for oranges is the same as the short-run demand, you would expect a binding price ceiling to result in a
that is
in the long run than in the short run.
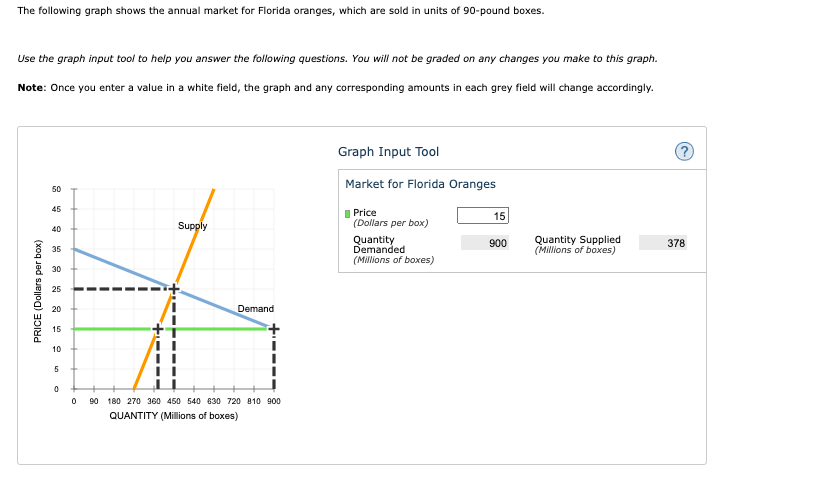
Transcribed Image Text:The following graph shows the annual market for Florida oranges, which are sold in units of 90-pound boxes.
Use the graph input tool to help you answer the following questions. You will not be graded on any changes you make to this graph.
Note: Once you enter a value in a white field, the graph and any corresponding amounts in each grey field will change accordingly.
Graph Input Tool
Market for Florida Oranges
50
46
I Price
(Dollars per box)
15
40
Supply
Quantity
Demanded
(Millions of boxes)
Quantity Supplied
(Millions of boxes)
900
378
35
30
25
20
Demand
15
10
5
90 180 270 360 450 540 630 720 810 900
QUANTITY (Millions of boxes)
PRICE (Dollars per box)
Expert Solution
This question has been solved!
Explore an expertly crafted, step-by-step solution for a thorough understanding of key concepts.

This is a popular solution!

Trending now
This is a popular solution!

Step by step
Solved in 2 steps

Knowledge Booster


Learn more about
Need a deep-dive on the concept behind this application? Look no further. Learn more about this topic, economics and related others by exploring similar questions and additional content below.Recommended textbooks for you


Economics (MindTap Course List)
Economics
ISBN:
9781337617383
Author:
Roger A. Arnold
Publisher:
Cengage Learning
