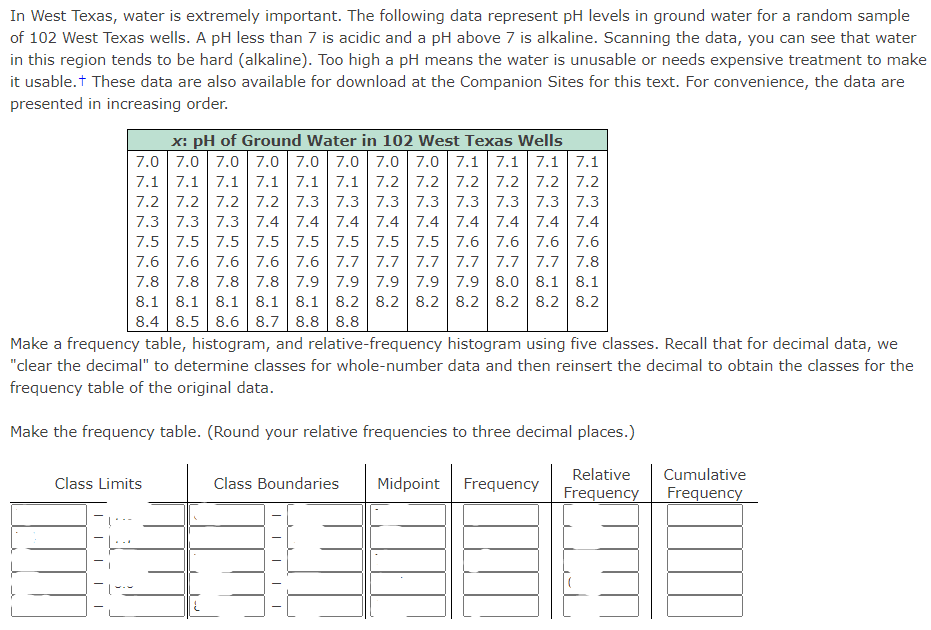
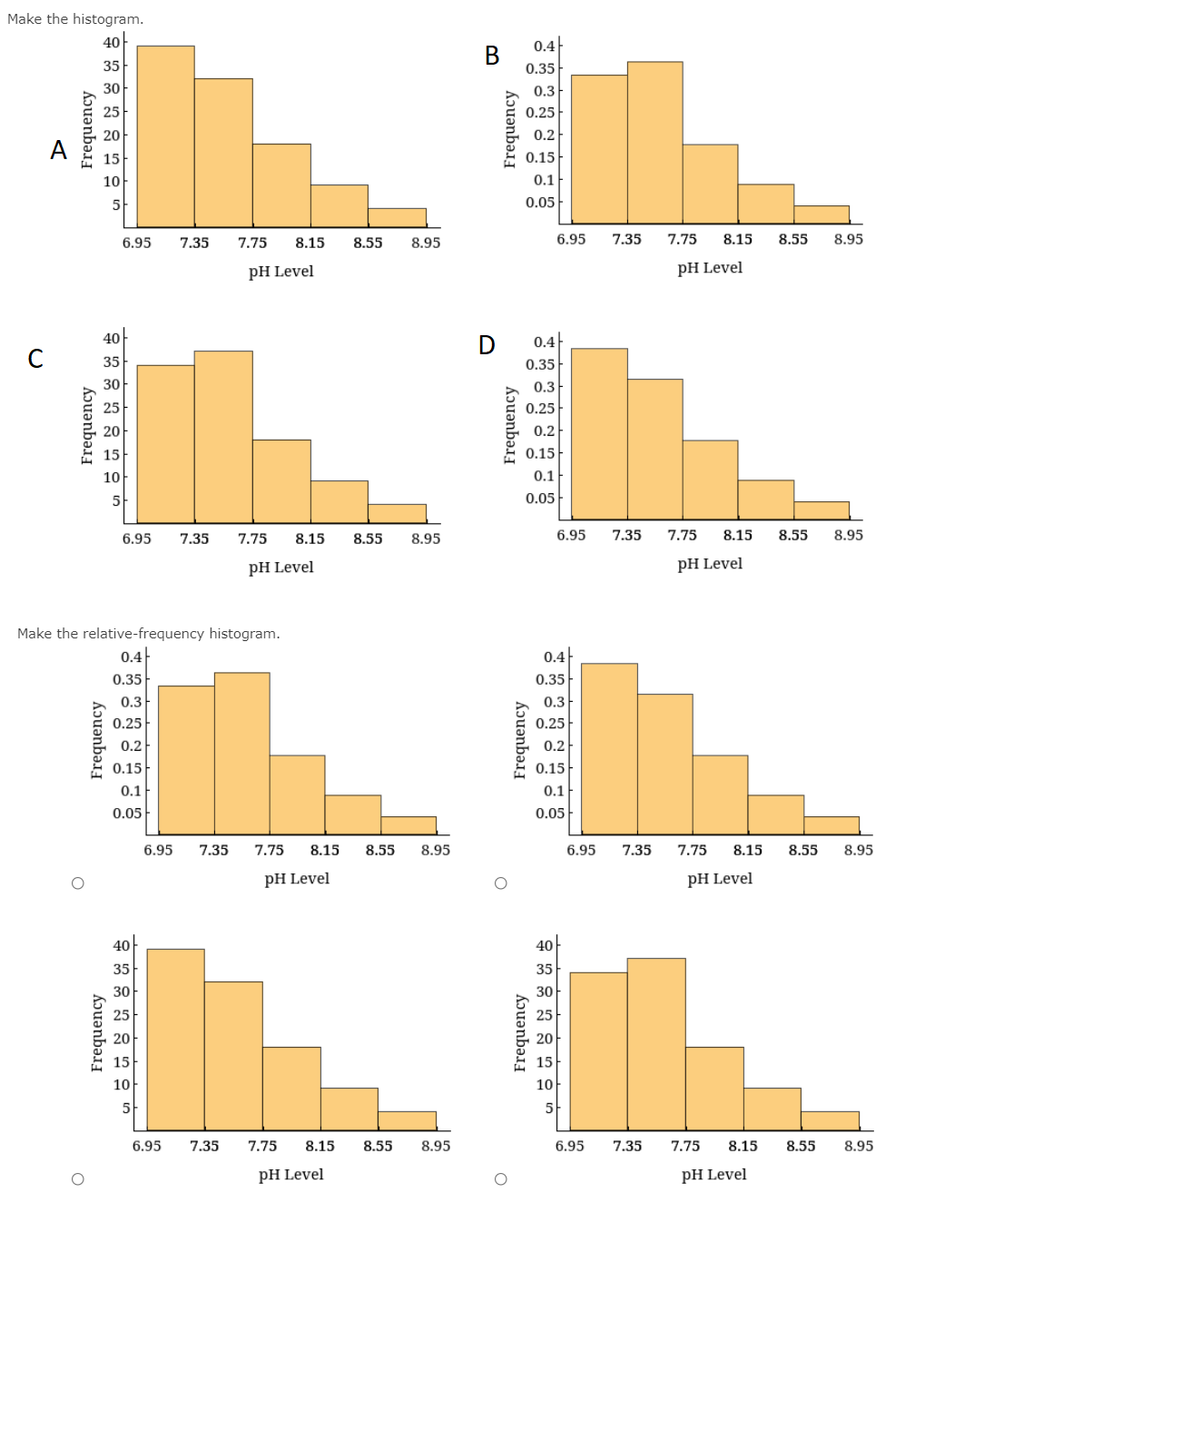
In West Texas, water is extremely important. The following data represent pH levels in ground water for a random sample of 102 West Texas wells. A pH less than 7 is acidic and a pH above 7 is alkaline. Scanning the data, you can see that water in this region tends to be hard (alkaline). Too high a pH means the water is unusable or needs expensive treatment to make it usable.† These data are also available for download at the Companion Sites for this text. For convenience, the data are presented in increasing order. (a) Make the frequency table. (Round your relative frequencies to three decimal places.) (b) Make the histogram. (c) Make the relative-frequency histogram.


Continuous Probability Distributions
Probability distributions are of two types, which are continuous probability distributions and discrete probability distributions. A continuous probability distribution contains an infinite number of values. For example, if time is infinite: you could count from 0 to a trillion seconds, billion seconds, so on indefinitely. A discrete probability distribution consists of only a countable set of possible values.
Normal Distribution
Suppose we had to design a bathroom weighing scale, how would we decide what should be the range of the weighing machine? Would we take the highest recorded human weight in history and use that as the upper limit for our weighing scale? This may not be a great idea as the sensitivity of the scale would get reduced if the range is too large. At the same time, if we keep the upper limit too low, it may not be usable for a large percentage of the population!
In West Texas, water is extremely important. The following data represent pH levels in ground water for a random sample of 102 West Texas wells. A pH less than 7 is acidic and a pH above 7 is alkaline. Scanning the data, you can see that water in this region tends to be hard (alkaline). Too high a pH means the water is unusable or needs expensive treatment to make it usable.† These data are also available for download at the Companion Sites for this text. For convenience, the data are presented in increasing order.


Trending now
This is a popular solution!

Step by step
Solved in 3 steps


