Following some school examinations, Ajok is studying the results of the 16 students in her class. The mark for paper 1, , and the mark for paper 2, , for each student are summarised in the following statistics. X Mean= 35.75 , Y Mean=25.75 , St Dev of X=8.05 ,St Dev of Y=12.3 , R=0.75 Ajok decides to examine these data in more detail and plots the marks for each of the 16 students on the scatter diagram. Graph Attached Using the summary statistics above, calculate the equation of the line of regression of y on x for these 16 students, giving your answer in the form yhat = a+bx Ajok decides to omit the data point (38,0) and examine the other 15 students’ marks. The correlation coefficient is now R = 0.95. Explain why you think Ajok decides to omit the data point (38.0). Using the following summary statistics calculate the equation of the line of regression of y on x for these 15 students X Mean= 35.6 , Y Mean=27.47 , St Dev of X=8.31 ,St Dev of Y=10.56, R=0.95 Give your answer in the form of yhat = a+bx Predict the mark in the second paper for a student who scored 38 marks in the first paper. Find the value of x such that yhat=0 . Comment on whether predicting y for lower values of x makes sense.


Correlation
Correlation defines a relationship between two independent variables. It tells the degree to which variables move in relation to each other. When two sets of data are related to each other, there is a correlation between them.
Linear Correlation
A correlation is used to determine the relationships between numerical and categorical variables. In other words, it is an indicator of how things are connected to one another. The correlation analysis is the study of how variables are related.
Regression Analysis
Regression analysis is a statistical method in which it estimates the relationship between a dependent variable and one or more independent variable. In simple terms dependent variable is called as outcome variable and independent variable is called as predictors. Regression analysis is one of the methods to find the trends in data. The independent variable used in Regression analysis is named Predictor variable. It offers data of an associated dependent variable regarding a particular outcome.
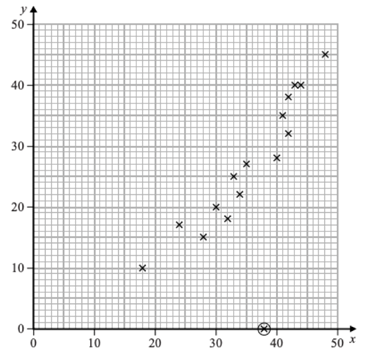
Following some school examinations, Ajok is studying the results of the 16 students in her class. The mark for paper 1, , and the mark for paper 2, , for each student are summarised in the following statistics.
X Mean= 35.75 , Y Mean=25.75 , St Dev of X=8.05 ,St Dev of Y=12.3 , R=0.75
Ajok decides to examine these data in more detail and plots the marks for each of the 16 students on the
Graph Attached
- Using the summary statistics above, calculate the equation of the line of regression of y on x for these 16 students, giving your answer in the form yhat = a+bx
- Ajok decides to omit the data point (38,0) and examine the other 15 students’ marks. The
correlation coefficient is now R = 0.95.
Explain why you think Ajok decides to omit the data point (38.0).
- Using the following summary statistics calculate the equation of the line of regression of y on x for these 15 students X Mean= 35.6 , Y Mean=27.47 , St Dev of X=8.31 ,St Dev of Y=10.56, R=0.95 Give your answer in the form of yhat = a+bx
- Predict the mark in the second paper for a student who scored 38 marks in the first paper.
- Find the value of x such that yhat=0 . Comment on whether predicting y for lower values of x makes sense.


Trending now
This is a popular solution!

Step by step
Solved in 4 steps with 3 images


