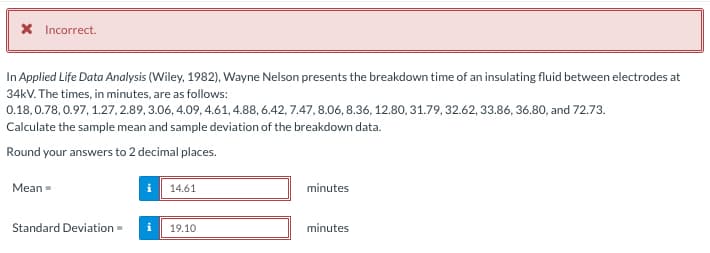
* Incorrect. In Applied Life Data Analysis (Wiley, 1982), Wayne Nelson presents the breakdown time of an insulating fluid between electrodes at 34kV. The times, in minutes, are as follows: 0.18, 0.78, 0.97, 1.27,2.89, 3.06, 4.09, 4.61, 4.88, 6.42,7.47, 8.06, 8.36, 12.80, 31.79, 32.62, 33.86, 36.80, and 72.73. Calculate the sample mean and sample deviation of the breakdown data. Round your answers to 2 decimal places. Mean- Standard Deviation => 14.61 19.10 minutes minutes


Q: 2.11 Convert the distribution obtained in the preceding ex- ercise into a cumulative "less than or…
A: From given data : now we have to find preceding exercise to a less than or equal distribution…
Q: 2. Find the linear polynomial (y = mx + b) that is the least square fit to the following data: (Show…
A: Given : Data is X 0 1 2 3 Y 1 0 1 2
Q: Find the equation of the least squares line. The paired data below consist of the test scores of 6…
A: Data is given for hours (x) and score (y) We have to calculate least square line Y=a+bx
Q: Assortative Mating: Assortative mating is a nonrandom mating pattern where individuals with similar…
A: Hey there! Thank you for posting the question. Since your question has more than 3 parts, we are…
Q: proof that for and three events A i B and C defined on the Sample Space s such that P(BIA) <(CIA).…
A:
Q: Interpret the value of IQR in the above table.
A: Using the given table, The value of interquartile range (IQR) is 3692. Now, We know that the IQR…
Q: ANSWER THE LAST QUESTION PLEASE Major League Baseball now records information about every pitch…
A: Given information: This study showed that the speeds of fastballs forms a normal distribution with…
Q: e following table shows students' test scores on the first two tests Answer First test, x ©2022…
A: We have given that, The data set are :- X :- 59, 59, 65, 93, 57, 71, 47, 66, 84, 70, 76, 78 Y:- 71,…
Q: The Interquartile range IQR is a useful measure of data spread utilizing relative position. the…
A: Given data Q1 = 8 Q3 = 11.5
Q: An LCBO employee compares the relationship between the price of 6 different vintage bottles of wine,…
A: Given data is No.of wine bottles purchased in a last 3 month(x) Price of wine bottle($) 44 25…
Q: An economist conducted a study of the possible association between weekly income and weekly grocery…
A: Answer: From the given data, An economist conducted a study of the possible association between…
Q: The probability that a randomly selected 4-year-old male feral cat will live to be 5 years old is…
A: It is given that the probability that a randomly selected 4-year-old male feral cat will live to be…
Q: An experiment is run. The mass of an object is recorded over time. Time (min) Mass (g) 22 49 39 41…
A: Given data: Time (min) Mass (g) 22 49 39 40 41 38 42 36 50 25
Q: To have a better understanding of her students, a lecturer gives out a questionnaire at the…
A: Hint: The variable having qualitative properties is known as a categorical variable. The graphical…
Q: Find the coefficient of determination given that the value of the linear correlation coefficient, r,…
A: Given the value of the linear correlation coefficient(r) = 0.802
Q: Construct a S-L/J chart and identify the Westgard rule violated (if any) and the type of error…
A: 3. From the part 2, Mean=120.3 standard deviation, s=2.43. ±1 SD=117.87, 122.73±2 SD=115.44,…
Q: Based on the data shown below, calculate the correlation coefficient (rounded to three decimal…
A: The data shows x and y variables.
Q: If and . Calculate P(A) = 0.4 P (B) = 0.3, P(An B) = 0.1 P(A|B) Enter your answer with two decimal…
A:
Q: Check here for instructional material to complete this problem. Evaluate the following formula for…
A:
Q: Attempting to improve the quality of services provided to customers, the owner of a chain of…
A: The objective is to validate if the training of the sales personnel is truly effective, i.e., the…
Q: The gross domestic product (GDP) of a certain country, which measures the overall size of the…
A:
Q: What do you value most when shopping in a retail store? According to a survey, 26% of consumers…
A: The random variable personalized experience follows normal distribution. We have to construct 95%…
Q: What is the average amount of sleep an undergraduate college student gets each night? A survey of…
A: Introduction A sample is a selection of subset of individuals from a larger group of data. A…
Q: Assuming that the population is normally distributed, construct 99% confidence interval for the…
A: Data given Sample A: 1, 4, 4, 4, 5, 5, 5, 8 Sample B: 1, 2, 3, 4, 5, 6, 7, 8
Q: Test the claim that the mean GPA of night students is smaller than 2.3 at the .005 significance…
A:
Q: A pair of dice is rolled 10 times. What is the probability that exactly 2 rolls would result in…
A: Given information: A pair of dice is rolled 10 times. So, n = 10 , x =2 Find: P(X=2) Binomial…
Q: Emilio wants to estimate the percentage of people who have a financial adviser. He surveys 350…
A: given data n = 350 x = 76 we have to interprete 99% confidence intervl.
Q: Evaluate the following formula for x₁ = 27.9195, x₂ = 26.1823, H₁-H₂ = 0, sp = 45.90, n₁ = 41, and n…
A: Given formula: t=x¯1-x¯2-μ1-μ2sp2n1+sp2n2
Q: True or False? For a two-tailed test using z values at the 5% significance level we reject H0 if z ≤…
A: Here we have given the true or false statement about the critical region. The given statement is,…
Q: Procedure 1. Control solution A was analyzed daily, and the following values were obtained: Days of…
A: Introduction: As requested, we have helped you answer parts a, b, c, and d of question 2.
Q: A doctor claims that the standard deviation of systolic blood pressure is 12 mmHg. A random sample…
A: given data claim : σ = 12 n = 24 S = 14 α = 0.01χ2 critical values = ?
Q: 4. Paired Sample T-Test: A researcher is interested in infants' attention to their mothers' voices.…
A: The sample data consists of the number of seconds that the infant oriented in the direction of…
Q: The table shows the weekly income of 20 randomly selected full-time students. If the student did not…
A: Data given 565,521,569,189,592,250,222,504,0,206,3356,443,0,277,194,227,114,0,0,505
Q: Suppose we want to use data on square footage to predict home sale prices. An equation that fits the…
A: Given: Predicted Selling price = 17.93 + 0.17 (Square Footage) Formula Used: Error = Observed…
Q: Control (CDC), 47% of Americans get a flu shot each season. Round your answers to 4 decimal places.…
A: Given that Probability of success p=0.47 Number of trials n=4 X~binomial(n,p)
Q: Use pooled estimator of p. a. What is the p-value (to 4 decimals)? Use Table 1 from Appendix B. 0
A:
Q: n a random sample of 1500 BA majors who are graduating from the University of Cape Town this autumn…
A: Let X be the observe value 1380 n be the sample size n=1500
Q: 4. What is the critical value? 4. What is your decision regarding Ho? Reject Ho or don't reject Ho?
A: It is given that Test is that whether the variance of nicotine content is less than 0.0644 Sample…
Q: bin width for these data sets and sample size. Describe what wou you were to use bin widths of 0.01…
A: observation_date CPIAUCSL FLEXCPIM679SFRBATL 1967-03-01 33.000 0.742523431 1967-04-01 33.100…
Q: Find the probability of randomly selecting a student who kept the money, given that the student was…
A: Given that Purchased Gum = X Kept the money = Y Total Students given four quarter = A 31 12…
Q: Check here for instructional material to complete this problem. The variable df is defined to be the…
A: Given data,the variable df is defined to be smaller of n1-1 and n2-1find df = ?n1 = 184n2 = 193
Q: the table of information pendent), and yearly salary - is the correlation coeffic
A: Hi! Thank you for the question, As per the honour code, we are allowed to answer three sub-parts at…
Q: A random variable X is uniformly distributed in the interval (-5, 15). Another random variable…
A:
Q: (b) Professor Watson has an average value of Beauty, while Professor Stock's value of Beauty is one…
A: Introduction: It is required to predict course evaluations (COURSE_EVAL) of Professor Stock and…
Q: 1.128 Find some proportions. Using your calculator or software, find the vations from a standard…
A: Given that. X~N( 0 , 1 ) μ=0 , ?=1 (for standard normal distribution) Z-score =( x - μ )/?…
Q: Problem 6: A fair coin is flipped three times. The random variable W represents the number of heads…
A: Answer:- Given, A fair coin is flipped three times. Then sample space S = {…
Q: reports that the average expenditure on Valentine's Day was expected to be $100.89. Do male and…
A: Given that Sample sizes n1=60 , n2=37 Sample means X̄1=133.15 , X̄2= 60.72 ?1 =31…
Q: At a certain university, the average cost of books was $390 per student last semester and the…
A: σ = 75claim : μ>390x¯ = 415n =55test value = ?
Q: F H K 95% Confidence Interval for Average Age of Online College Students: e Mean: e St. Dev: ple…
A: In above scenario we have to construct confidence interval for one population mean The formula for…
Q: Solve the problem. A study was conducted to compare the average time spent in the lab each week…
A: The given data shows the number of hours pent in lab and their percentages.

Step by step
Solved in 2 steps with 2 images

- In Applied Life Data Analysis (Wiley, 1982), Wayne Nelson presents the breakdown time of an insulating fluid between electrodes at 34 kV. The times, in minutes, are as follows: 0.19, 0.78, 0.96, 1.31, 2.78, 3.16, 4.15, 4.67, 4.85, 6.50, 7.35, 8.01, 8.27, 12.06, 31.75, 32.52, 33.91, 36.71, and 72.89. Calculate the sample mean and sample standard deviation.An article in the ASCE Journal of Energy Engineering [“Overview of Reservoir Release Improvements at 20 TVA Dams” (Vol. 125, April 1999, pp. 1–17)] presents data on dissolved oxygen concentrations in streams below 20 dams in the Tennessee Valley Authority system. The observations are (in milligrams per liter):) The following table shows 10 communities ranked by decayed, missing, or filled (DMF) teeth per 100 children and fluoride concentration in ppm in the public water supply: Rank by DMF Teeth FluorideCommunity per 100 children X Concentration Y 1 8 1 2 9 3 3 7 4 4 3 9 5 2 8 6 4 77 1…
- The annual flows, in cubic meters per second, at the Weldon River at Mill Grove, Missouri for the period 1930 to 1960 are averaged as follows: 3.06 1.52 16.00 2.78 1.15 13.39 2.74 6.16 1.21 5.90 4.06 2.66 11.29 8.46 7.04 12.51 10.91 16.09 3.46 4.28 6.92 11.35 6.95 3.23 18.70 3.75 1.25 2.063.83 18.02 14 .41Fit the lognormal distribution to this data. Comment on the goodness-of-fit to the lognormal distribution.Life-saving drug: Penicillin is produced by the Penicillin fungus, which is grown in a broth whose sugar content must be carefully controlled. Several samples of broth were taken on three successive days, and the amount of dissolved sugars, in milligrams per milliliter, was measured on each sample. The results were as follows. Day 1: 5.2 5.0 5.4 5.2 5.3 5.0 4.9 5.0 5.2 5.0 4.6 5.3 Day 2: 5.6 4.8 4.9 5.3 5.2 4.9 5.4 5.0 5.4 4.9 5.5 5.4 Day 3: 5.9 4.9 5.3 5.4 5.2 5.5 5.0 5.8 5.5 5.4 5.4 5.1 Construct an ANOVA table. Round your answers to four decimal places as needed. One-way ANOVA: Sugar Concentration Source DF SS MS F P Days Error TotalA chemical reaction is run 12 times, and the temperature xi (in °C) and the yield yi (in percent of a theoretical maximum) is recorded each time. The following summary statistics are recorded: x⎯⎯=65.0, y⎯⎯=29.03,∑ni=1(xi−x⎯⎯)2=6032.0,∑ni=1(yi−y⎯⎯)2=835.42,∑ni=1(xi−x⎯⎯)(yi−y⎯⎯)=1988.6x¯=65.0, y¯=29.03,∑i=1n(xi−x¯)2=6032.0,∑i=1n(yi−y¯)2=835.42,∑i=1n(xi−x¯)(yi−y¯)=1988.6 Let β0 represent the hypothetical yield at a temperature of 0°C, and let β1 represent the increase in yield caused by an increase in temperature of 1°C. Assume that assumptions 1 through 4 for errors in linear models hold. Find a 95% prediction interval for the yield of a particular reaction at a temperature of 40°C. Round the answers to three decimal places. The 95% prediction interval is ( , ).
- A chemical reaction is run 12 times, and the temperature xi (in °C) and the yield yi (in percent of a theoretical maximum) is recorded each time. The following summary statistics are recorded: x⎯⎯=65.0, y⎯⎯=29.03,∑ni=1(xi−x⎯⎯)2=6032.0,∑ni=1(yi−y⎯⎯)2=835.42,∑ni=1(xi−x⎯⎯)(yi−y⎯⎯)=1988.6x¯=65.0, y¯=29.03,∑i=1n(xi−x¯)2=6032.0,∑i=1n(yi−y¯)2=835.42,∑i=1n(xi−x¯)(yi−y¯)=1988.6 Let β0 represent the hypothetical yield at a temperature of 0°C, and let β1 represent the increase in yield caused by an increase in temperature of 1°C. Assume that assumptions 1 through 4 for errors in linear models hold. Compute the error variance estimate s2. Round the answer to three decimal places.When water flows across farmland, some soil is washed away, resulting in erosion. An experiment was conducted to investigate the effect of the rate of water flow (liters per second) on the amount of soil (kilograms) washed away. The data are given in the following table: Flow rate 0.31 0.85 1.26 2.47 3.75 Eroded soil 0.82 1.95 2.18 3.01 6.07 Let xx represent the flow rate variable and yy represent the variable for soil eroded. Then \bar x = 1.73, s_x = 1.38, \bar y = 2.81, s_y = 1.99xˉ=1.73,sx=1.38,yˉ=2.81,sy=1.99 Use this to complete the following calculation of the correlation coefficient for these data. r = \frac{1}{n-1}\left[\left(\frac{x_1 - \bar x}{s_x}\right)\left(\frac{y_1 - \bar y}{s_y}\right) + \left(\frac{x_2 - \bar x}{s_x}\right)\left(\frac{y_2 - \bar y}{s_y}\right) + \cdots + \left(\frac{x_n - \bar x}{s_x}\right)\left(\frac{y_n - \bar y}{s_y}\right)\right]r=n−11[(sxx1−xˉ)(syy1−yˉ)+(sxx2−xˉ)(syy2−yˉ)+⋯+(sxxn−xˉ)(syyn−yˉ)]…3. The following Table gives data on output per hour (X) and real compensation per hour (Y) for the business and nonfarm business sectors of the U.S. economy. Year 1990 Y X 1991 1 10 1992 3 15 4 20 Estimate the slope of the OLS regression of Y on X (ẞ2) from the following regression: Yi = β₁ + β2 Xi + Ui
- The data given below indicate the existence of a linear relationship between the x and y variables. Suppose an analyst who prepared the solutions and carried out the RI measurements was not skilled and as a result of poor technique, allowed intermediate errors to appear. The results are the following:Concentration of solution in percent (x) 10 26 33 50 61Refractive indices (y) 1.497 1.493 1.485 1.478 1.477Step 1. Carefully plot the given x and y values (from the table) on a regular graphing paper. Label then connect the points to observe a zigzag plot due to the scattered points. Step 2: Copy and fill the table given below: x (x - x̄) (x - x̄) 2 y (y - ȳ) (y - ȳ) 2 (x - x̄) (y - ȳ) 10 1.497 26 1.49333 1.48550 1.47861 1.477∑ = ∑ = ∑ = ∑ = ∑ = ∑ = ∑ =x̄= ∑xi ÷ Nx̄= ȳ = ∑yi ÷ Nȳ = Step 3. After completing the table, present following computations and the interpretation.a. Calculate the correlation coefficient (r), using the working formula: r =Σ (x − x ) (y − ȳ)√(Σ(x − x )2)(Σ(y −…Periodically, the county Water Department tests the drinking water of homeowners for contaminants such as lead and copper. The lead and copper levels in water specimens collected in 1998 for a sample of 10 residents of a subdevelopement of the county are shown below. lead (μμg/L) copper (mg/L) 4.4 0.643 2.4 0.57 1.5 0.46 2.6 0.895 5.9 0.2 3.4 0.54 3.8 0.245 1.6 0.583 5.7 0.769 1.7 0.215 (a) Construct a 9999% confidence interval for the mean lead level in water specimans of the subdevelopment. ≤μ≤For these (x,y) pairs of data points: 1,5 3,7 4,6 5,8 7,9 Compute b1. Compute b0. What is the equation of the regression line?